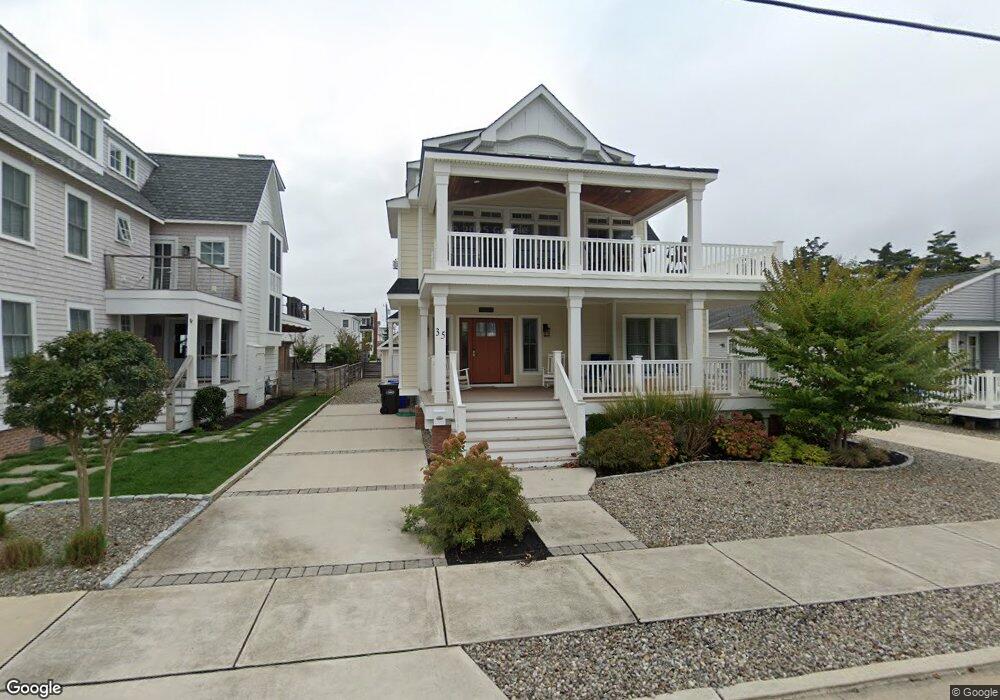
35 18th St W Avalon, NJ 08202
Estimated Value: $4,196,000 - $5,108,000
--
Bed
--
Bath
3,817
Sq Ft
$1,167/Sq Ft
Est. Value
About This Home
This home is located at 35 18th St W, Avalon, NJ 08202 and is currently estimated at $4,455,593, approximately $1,167 per square foot. 35 18th St W is a home located in Cape May County with nearby schools including Avalon Elementary School.
Ownership History
Date
Name
Owned For
Owner Type
Purchase Details
Closed on
Aug 2, 1997
Sold by
Schwender Dorothy
Bought by
Murphy William and Murphy Patricia
Current Estimated Value
Home Financials for this Owner
Home Financials are based on the most recent Mortgage that was taken out on this home.
Original Mortgage
$345,000
Outstanding Balance
$51,530
Interest Rate
7.5%
Estimated Equity
$4,404,063
Purchase Details
Closed on
Oct 14, 1989
Sold by
Leahy Realty Inc
Bought by
Schwender James and Schwender Dorothy
Purchase Details
Closed on
Sep 15, 1988
Sold by
Duffy Thomas and Duffy Eileen
Bought by
Leahy Realty Inc
Create a Home Valuation Report for This Property
The Home Valuation Report is an in-depth analysis detailing your home's value as well as a comparison with similar homes in the area
Home Values in the Area
Average Home Value in this Area
Purchase History
| Date | Buyer | Sale Price | Title Company |
|---|---|---|---|
| Murphy William | $431,000 | -- | |
| Schwender James | $439,000 | -- | |
| Leahy Realty Inc | $210,000 | -- |
Source: Public Records
Mortgage History
| Date | Status | Borrower | Loan Amount |
|---|---|---|---|
| Open | Murphy William | $345,000 |
Source: Public Records
Tax History Compared to Growth
Tax History
| Year | Tax Paid | Tax Assessment Tax Assessment Total Assessment is a certain percentage of the fair market value that is determined by local assessors to be the total taxable value of land and additions on the property. | Land | Improvement |
|---|---|---|---|---|
| 2025 | $14,151 | $2,304,700 | $1,200,000 | $1,104,700 |
| 2024 | $14,151 | $2,304,700 | $1,200,000 | $1,104,700 |
| 2023 | $14,036 | $2,304,700 | $1,200,000 | $1,104,700 |
| 2022 | $13,091 | $2,304,700 | $1,200,000 | $1,104,700 |
| 2021 | $12,607 | $2,304,700 | $1,200,000 | $1,104,700 |
| 2020 | $12,123 | $2,304,700 | $1,200,000 | $1,104,700 |
| 2019 | $11,754 | $2,304,700 | $1,200,000 | $1,104,700 |
| 2018 | $11,247 | $2,304,700 | $1,200,000 | $1,104,700 |
| 2017 | $5,004 | $900,000 | $900,000 | $0 |
| 2016 | $6,324 | $1,149,900 | $900,000 | $249,900 |
| 2015 | $6,221 | $1,149,900 | $900,000 | $249,900 |
| 2014 | $6,152 | $1,149,900 | $900,000 | $249,900 |
Source: Public Records
Map
Nearby Homes