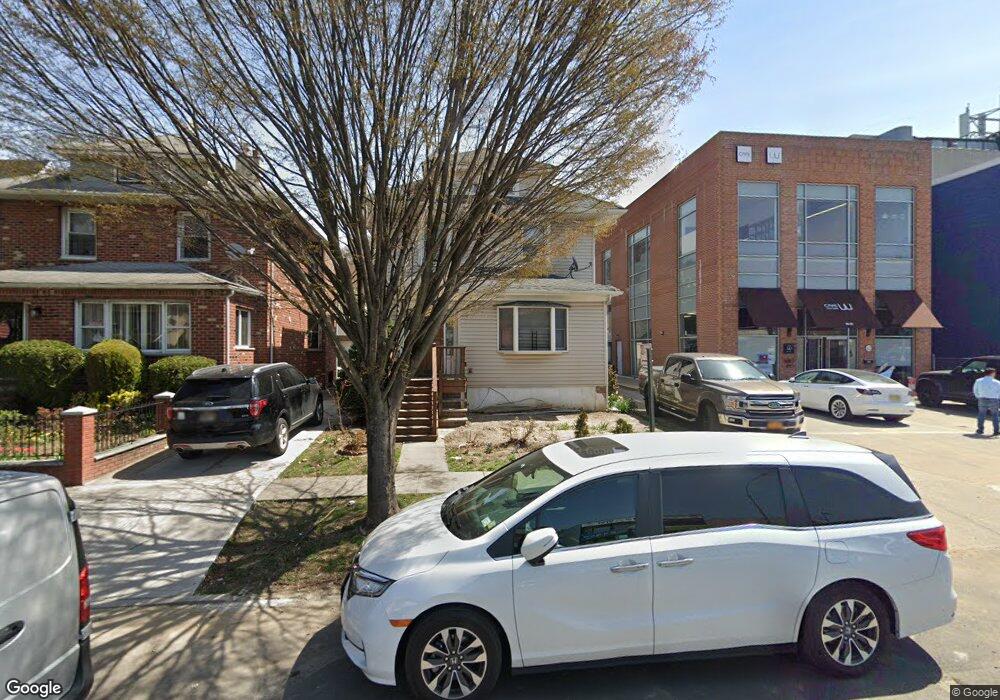
35-25 154th St Flushing, NY 11354
Flushing NeighborhoodEstimated Value: $1,759,685
--
Bed
3
Baths
1,688
Sq Ft
$1,042/Sq Ft
Est. Value
About This Home
This home is located at 35-25 154th St, Flushing, NY 11354 and is currently estimated at $1,759,685, approximately $1,042 per square foot. 35-25 154th St is a home located in Queens County with nearby schools including P.S. 32 - State Street, I.S. 25 Adrien Block, and Francis Lewis High School.
Ownership History
Date
Name
Owned For
Owner Type
Purchase Details
Closed on
Dec 1, 2005
Sold by
Lee Jung Sook and Lee Matthew
Bought by
M & L 2005 Llc
Current Estimated Value
Purchase Details
Closed on
Aug 23, 2005
Sold by
Choi Sunny S and Hyungmoo Choi Michael
Bought by
Lee Jung Sook and Lee Matthew
Home Financials for this Owner
Home Financials are based on the most recent Mortgage that was taken out on this home.
Original Mortgage
$450,000
Outstanding Balance
$238,362
Interest Rate
5.79%
Mortgage Type
Purchase Money Mortgage
Estimated Equity
$1,521,323
Purchase Details
Closed on
Jan 13, 2004
Sold by
Mulhaire Carmel and Mulhaire Martin
Bought by
Choi Michael Hyungmoo and Choi Sunny S
Home Financials for this Owner
Home Financials are based on the most recent Mortgage that was taken out on this home.
Original Mortgage
$409,000
Interest Rate
5.82%
Mortgage Type
Purchase Money Mortgage
Create a Home Valuation Report for This Property
The Home Valuation Report is an in-depth analysis detailing your home's value as well as a comparison with similar homes in the area
Home Values in the Area
Average Home Value in this Area
Purchase History
| Date | Buyer | Sale Price | Title Company |
|---|---|---|---|
| M & L 2005 Llc | -- | -- | |
| M & L 2005 Llc | -- | -- | |
| Lee Jung Sook | $900,000 | -- | |
| Lee Jung Sook | $900,000 | -- | |
| Choi Michael Hyungmoo | $585,000 | -- | |
| Choi Michael Hyungmoo | $585,000 | -- |
Source: Public Records
Mortgage History
| Date | Status | Borrower | Loan Amount |
|---|---|---|---|
| Open | Lee Jung Sook | $450,000 | |
| Closed | Lee Jung Sook | $450,000 | |
| Previous Owner | Choi Michael Hyungmoo | $409,000 |
Source: Public Records
Tax History Compared to Growth
Tax History
| Year | Tax Paid | Tax Assessment Tax Assessment Total Assessment is a certain percentage of the fair market value that is determined by local assessors to be the total taxable value of land and additions on the property. | Land | Improvement |
|---|---|---|---|---|
| 2025 | $7,685 | $39,196 | $11,505 | $27,691 |
| 2024 | $7,685 | $38,263 | $11,661 | $26,602 |
| 2023 | $7,254 | $36,116 | $10,435 | $25,681 |
| 2022 | $6,866 | $57,120 | $17,700 | $39,420 |
| 2021 | $6,876 | $55,440 | $17,700 | $37,740 |
| 2020 | $6,914 | $66,780 | $17,700 | $49,080 |
| 2019 | $6,670 | $70,320 | $17,700 | $52,620 |
| 2018 | $6,135 | $30,097 | $9,088 | $21,009 |
| 2017 | $5,843 | $28,663 | $9,221 | $19,442 |
| 2016 | $5,443 | $28,663 | $9,221 | $19,442 |
| 2015 | $3,261 | $27,219 | $11,174 | $16,045 |
| 2014 | $3,261 | $26,572 | $12,021 | $14,551 |
Source: Public Records
Map
Nearby Homes
- 39-25 Murray St
- 34-15 153rd St
- 3419 Murray St
- 33-38 153rd St
- 40-11 157th St
- 3425 150th Place Unit 6E
- 34-25 150th Place Unit 2C
- 33-06 154th St
- 33-47 158th St
- 40-25 158th St
- 155-17 Sanford Ave Unit 2
- 155-17 Sanford Ave Unit 2F
- 152-18 33rd Ave
- 151-14 33rd Ave
- 151-10 33rd Ave
- 150-23 Barclay Ave Unit 5A
- 150-23 Barclay Ave Unit 4H
- 3323 158th St
- 35-10 150th St Unit 4
- 3225 155th St
- 3525 154th St
- 3525 154th St
- 3521 154th St
- 35-27 154th St
- 3527 154th St
- 35-29 154th St Unit 2FL
- 35-29 154th St
- 3517 154th St
- 3526 155th St
- 3530 155th St
- 3511 154th St
- 15401 Northern Blvd
- 3520 155th St
- 3530 155th St Unit 1F
- 3530 155th St Unit 2Fl
- 3530 155th St Unit 1 Fl
- 3530 155th St Unit 1 Fl
- 3530 155th St
- 3530 155th St Unit 2Fl
- 3530 155th St