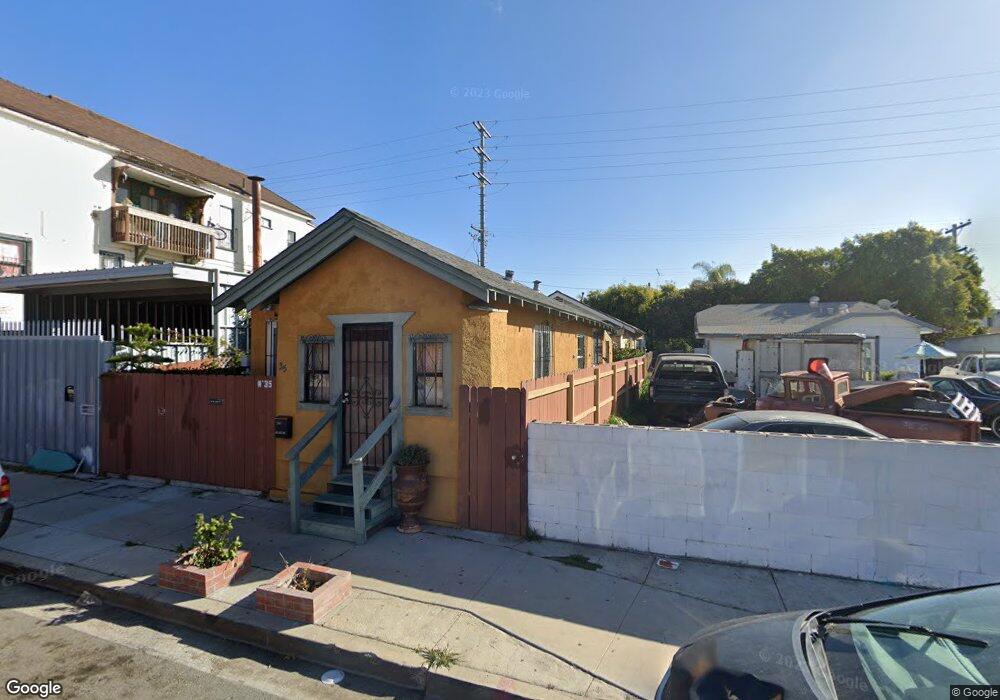
35 27th St San Diego, CA 92102
Logan Heights NeighborhoodEstimated Value: $466,000 - $583,794
1
Bed
1
Bath
608
Sq Ft
$889/Sq Ft
Est. Value
About This Home
This home is located at 35 27th St, San Diego, CA 92102 and is currently estimated at $540,449, approximately $888 per square foot. 35 27th St is a home located in San Diego County with nearby schools including Burbank Elementary School, Logan Memorial Educational Campus, and King-Chavez Academy Of Excellence.
Ownership History
Date
Name
Owned For
Owner Type
Purchase Details
Closed on
Mar 11, 2014
Sold by
Jones Stephen C
Bought by
Naranjo Soledad
Current Estimated Value
Home Financials for this Owner
Home Financials are based on the most recent Mortgage that was taken out on this home.
Original Mortgage
$135,327
Interest Rate
4.4%
Mortgage Type
FHA
Purchase Details
Closed on
Nov 13, 2006
Sold by
Greenberg Stanley H and Jones Stephen C
Bought by
Jones Stephen C
Purchase Details
Closed on
Jun 4, 1997
Sold by
Jones Catherine A
Bought by
Jones Stephen C
Purchase Details
Closed on
Apr 26, 1996
Sold by
Jones Catherine
Bought by
Jones Stephen C
Purchase Details
Closed on
Jan 22, 1996
Sold by
Whiteside Cecilia R
Bought by
Greenberg Stan and Jones Stephen C
Create a Home Valuation Report for This Property
The Home Valuation Report is an in-depth analysis detailing your home's value as well as a comparison with similar homes in the area
Home Values in the Area
Average Home Value in this Area
Purchase History
| Date | Buyer | Sale Price | Title Company |
|---|---|---|---|
| Naranjo Soledad | $140,000 | Ticor Title Company Of Calif | |
| Jones Stephen C | $96,000 | None Available | |
| Jones Stephen C | -- | -- | |
| Jones Stephen C | -- | American Title Ins Co | |
| Greenberg Stan | $8,000 | American Title Ins Co |
Source: Public Records
Mortgage History
| Date | Status | Borrower | Loan Amount |
|---|---|---|---|
| Previous Owner | Naranjo Soledad | $135,327 |
Source: Public Records
Tax History Compared to Growth
Tax History
| Year | Tax Paid | Tax Assessment Tax Assessment Total Assessment is a certain percentage of the fair market value that is determined by local assessors to be the total taxable value of land and additions on the property. | Land | Improvement |
|---|---|---|---|---|
| 2025 | $2,244 | $171,607 | $98,062 | $73,545 |
| 2024 | $2,244 | $168,243 | $96,140 | $72,103 |
| 2023 | $2,191 | $164,945 | $94,255 | $70,690 |
| 2022 | $2,127 | $161,711 | $92,407 | $69,304 |
| 2021 | $2,107 | $158,542 | $90,596 | $67,946 |
| 2020 | $2,084 | $156,918 | $89,668 | $67,250 |
| 2019 | $2,049 | $153,842 | $87,910 | $65,932 |
| 2018 | $1,925 | $150,827 | $86,187 | $64,640 |
| 2017 | $80 | $147,871 | $84,498 | $63,373 |
| 2016 | $1,853 | $144,973 | $82,842 | $62,131 |
| 2015 | $1,828 | $142,796 | $81,598 | $61,198 |
| 2014 | $1,924 | $150,811 | $111,909 | $38,902 |
Source: Public Records
Map
Nearby Homes
- 2701-11 Imperial Ave
- 2680 L St
- 2567-69 L St
- 325 Dewey St
- 2547 Commercial St
- 244 26th St
- 2832 K St
- 1990 Harrison Ave
- 2946 Commercial St
- 2057-59 Harrison Ave
- 2942 N L St
- 2971/2971 1/2 Imperial Ave
- 2185 Harrison Ave
- 0 J St Unit NDP2509260
- 2948 Franklin Ave
- 2925 Franklin Ave
- 3035 L St
- 2451-53 Island Ave
- 918-32 27th St
- 918-32 27th St Unit 918-32
- 37 27th St
- 34 Evans St
- 36 Evans St
- 38 Evans St
- 2711 Imperial Ave
- 22 Evans St
- 2689 2689 Imperial Ave
- 2689 Imperial Ave
- 2679 Imperial Ave
- 2679 - 81 Imperial Ave
- 2710 Imperial Ave
- 2714 Imperial Ave
- 33 Evans St
- 2692 Imperial Ave
- 2667 Imperial Ave Unit A
- 2667 Imperial Ave
- 19 Evans St
- Evans Street Unit LOT G BLK 3 TR 208
- 116 Evans St
- 11 Evans St