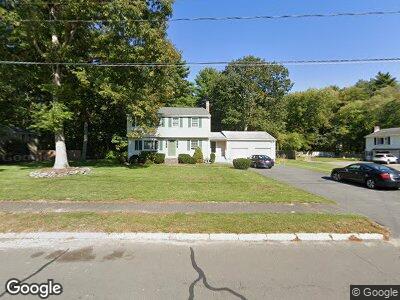
35 Adams St Foxboro, MA 02035
Foxborough NeighborhoodEstimated Value: $682,621 - $747,000
3
Beds
3
Baths
1,831
Sq Ft
$395/Sq Ft
Est. Value
About This Home
This home is located at 35 Adams St, Foxboro, MA 02035 and is currently estimated at $722,405, approximately $394 per square foot. 35 Adams St is a home located in Norfolk County with nearby schools including Foxborough Regional Charter School, The Sage School, and St Mary's Catholic School.
Ownership History
Date
Name
Owned For
Owner Type
Purchase Details
Closed on
Jun 7, 1996
Sold by
Whitney Bruce A and Whitney Marybeth P
Bought by
Kenney James E
Current Estimated Value
Home Financials for this Owner
Home Financials are based on the most recent Mortgage that was taken out on this home.
Original Mortgage
$142,000
Interest Rate
7.89%
Mortgage Type
Purchase Money Mortgage
Purchase Details
Closed on
Nov 6, 1995
Sold by
Smally Rt
Bought by
Whitney Bruce A and Whitney Marybeth P
Home Financials for this Owner
Home Financials are based on the most recent Mortgage that was taken out on this home.
Original Mortgage
$171,000
Interest Rate
7.58%
Mortgage Type
Purchase Money Mortgage
Create a Home Valuation Report for This Property
The Home Valuation Report is an in-depth analysis detailing your home's value as well as a comparison with similar homes in the area
Home Values in the Area
Average Home Value in this Area
Purchase History
| Date | Buyer | Sale Price | Title Company |
|---|---|---|---|
| Kenney James E | $207,000 | -- | |
| Whitney Bruce A | $190,000 | -- |
Source: Public Records
Mortgage History
| Date | Status | Borrower | Loan Amount |
|---|---|---|---|
| Closed | Kenney James E | $50,000 | |
| Open | Kenney James E | $250,000 | |
| Closed | Whitney Bruce A | $180,000 | |
| Closed | Kenney James E | $192,000 | |
| Closed | Kenney James E | $133,000 | |
| Closed | Whitney Bruce A | $142,000 | |
| Previous Owner | Whitney Bruce A | $171,000 |
Source: Public Records
Tax History Compared to Growth
Tax History
| Year | Tax Paid | Tax Assessment Tax Assessment Total Assessment is a certain percentage of the fair market value that is determined by local assessors to be the total taxable value of land and additions on the property. | Land | Improvement |
|---|---|---|---|---|
| 2025 | $7,346 | $555,700 | $223,200 | $332,500 |
| 2024 | $7,240 | $535,900 | $223,200 | $312,700 |
| 2023 | $6,961 | $489,900 | $212,500 | $277,400 |
| 2022 | $6,853 | $472,000 | $203,200 | $268,800 |
| 2021 | $6,623 | $449,300 | $184,700 | $264,600 |
| 2020 | $6,421 | $440,700 | $184,700 | $256,000 |
| 2019 | $6,139 | $417,600 | $176,000 | $241,600 |
| 2018 | $5,990 | $411,100 | $176,000 | $235,100 |
| 2017 | $5,772 | $383,800 | $164,400 | $219,400 |
| 2016 | $5,549 | $374,400 | $158,300 | $216,100 |
| 2015 | $5,478 | $360,600 | $133,700 | $226,900 |
| 2014 | $5,302 | $353,700 | $131,100 | $222,600 |
Source: Public Records
Map
Nearby Homes
- 11 Adams St
- 72 Cannon Forge Dr
- 5 Summer Place
- 11 Cannon Forge Dr
- 13 Cannon Forge Dr
- 168 Cannon Forge Dr
- 13 Willow St
- 7 Brookside Dr
- 4 Brookside Dr
- 4 Balcom Dr
- 18 Grover Ln
- 261R East St
- 110 Oak St
- 9 Windsor Dr
- 11 W Belcher Rd Unit 2
- 56 Spring St
- 165 Chestnut St Unit 2
- 7 Dane St Unit 2
- 161 Chestnut St Unit F
- 14 Morningside Ln