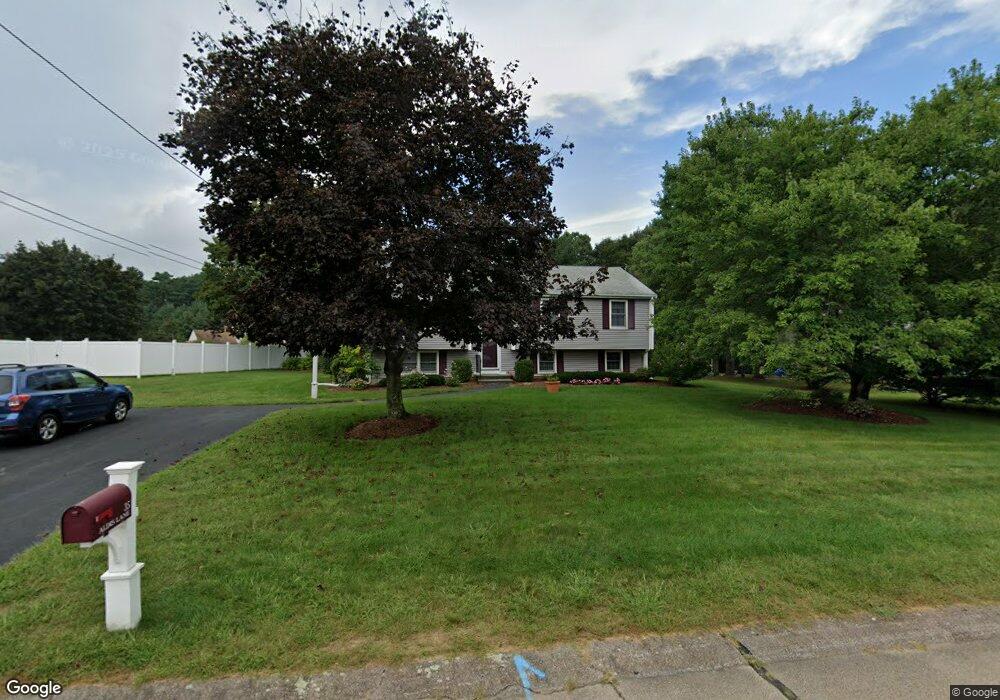
35 Aldis Ln Wrentham, MA 02093
Estimated Value: $597,000 - $615,003
3
Beds
2
Baths
1,312
Sq Ft
$461/Sq Ft
Est. Value
About This Home
This home is located at 35 Aldis Ln, Wrentham, MA 02093 and is currently estimated at $604,501, approximately $460 per square foot. 35 Aldis Ln is a home located in Norfolk County with nearby schools including Delaney Elementary School and Charles E Roderick.
Ownership History
Date
Name
Owned For
Owner Type
Purchase Details
Closed on
Jan 21, 2020
Sold by
Ryan Michael J and Ryan Deborah A
Bought by
Michael J Ryan T
Current Estimated Value
Purchase Details
Closed on
Aug 20, 1984
Bought by
Ryan Michael J and Ryan Deborah A
Create a Home Valuation Report for This Property
The Home Valuation Report is an in-depth analysis detailing your home's value as well as a comparison with similar homes in the area
Purchase History
| Date | Buyer | Sale Price | Title Company |
|---|---|---|---|
| Michael J Ryan T | -- | None Available | |
| Ryan Michael J | -- | -- |
Source: Public Records
Mortgage History
| Date | Status | Borrower | Loan Amount |
|---|---|---|---|
| Previous Owner | Ryan Michael J | $63,000 |
Source: Public Records
Tax History
| Year | Tax Paid | Tax Assessment Tax Assessment Total Assessment is a certain percentage of the fair market value that is determined by local assessors to be the total taxable value of land and additions on the property. | Land | Improvement |
|---|---|---|---|---|
| 2025 | $6,570 | $566,900 | $289,800 | $277,100 |
| 2024 | $6,092 | $507,700 | $289,800 | $217,900 |
| 2023 | $5,793 | $459,000 | $263,500 | $195,500 |
| 2022 | $5,646 | $413,000 | $245,900 | $167,100 |
| 2021 | $4,730 | $336,200 | $214,600 | $121,600 |
| 2020 | $5,335 | $374,400 | $190,900 | $183,500 |
| 2019 | $5,121 | $362,700 | $190,900 | $171,800 |
| 2018 | $4,981 | $349,800 | $191,000 | $158,800 |
| 2017 | $4,694 | $329,400 | $187,300 | $142,100 |
| 2016 | $4,611 | $322,900 | $181,900 | $141,000 |
| 2015 | $4,331 | $289,100 | $174,900 | $114,200 |
| 2014 | $4,259 | $278,200 | $168,200 | $110,000 |
Source: Public Records
Map
Nearby Homes
- 246 Forest Grove Ave
- 287 Park St
- 500 Franklin St
- 45 Joshua Rd
- 50 Reed Fulton Ave Unit Lot 61
- 10 Nature View Dr
- 15 Nature View Dr
- 0 W Birch Rd
- 8 Ridgefield Rd
- 11 Weber Farm Rd Unit 11
- 8 Weber Farm Rd Unit 8
- 30 Weber Farm Rd Unit 30
- 11 Earle Stewart Ln
- 12 Earle Stewart Ln
- 3 Earle Stewart Ln
- 11 Sharon Ave
- 9 Sharon Ave
- 10 Earle Stewart Ln Unit Lot 5
- 23 Fredrickson Rd
- 9 Elliot Mills Unit 5
Your Personal Tour Guide
Ask me questions while you tour the home.