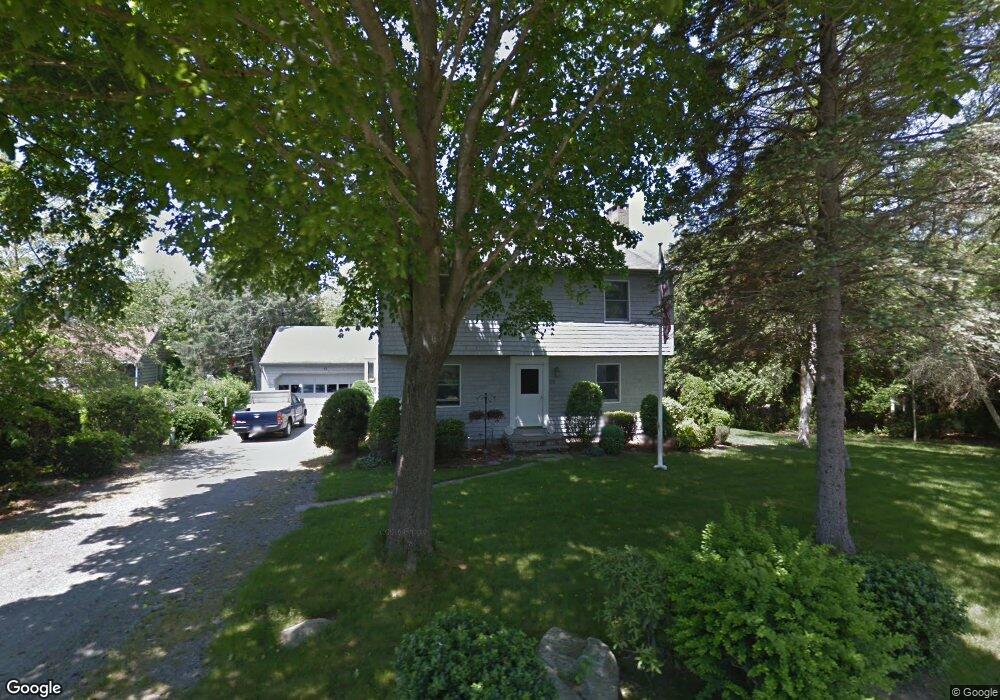
35 Bayview Rd Charlestown, RI 02813
Estimated Value: $877,000 - $2,024,000
3
Beds
2
Baths
1,920
Sq Ft
$721/Sq Ft
Est. Value
About This Home
This home is located at 35 Bayview Rd, Charlestown, RI 02813 and is currently estimated at $1,383,470, approximately $720 per square foot. 35 Bayview Rd is a home located in Washington County with nearby schools including Chariho Regional Middle School and Chariho High School.
Ownership History
Date
Name
Owned For
Owner Type
Purchase Details
Closed on
May 2, 2025
Sold by
Hedman Survivors T and Hedman H
Bought by
Oasis Richard and Oasis Pattie
Current Estimated Value
Home Financials for this Owner
Home Financials are based on the most recent Mortgage that was taken out on this home.
Original Mortgage
$806,501
Outstanding Balance
$803,109
Interest Rate
5.75%
Mortgage Type
Purchase Money Mortgage
Estimated Equity
$580,361
Purchase Details
Closed on
May 1, 2025
Sold by
Hedman Survivors T and Hedman H
Bought by
Oasis Richard and Oasis Pattie
Home Financials for this Owner
Home Financials are based on the most recent Mortgage that was taken out on this home.
Original Mortgage
$806,501
Outstanding Balance
$803,109
Interest Rate
5.75%
Mortgage Type
Purchase Money Mortgage
Estimated Equity
$580,361
Purchase Details
Closed on
Mar 3, 2016
Sold by
Hedman Ret
Bought by
Hedman Ret
Purchase Details
Closed on
May 14, 1974
Bought by
Hedman Ret
Create a Home Valuation Report for This Property
The Home Valuation Report is an in-depth analysis detailing your home's value as well as a comparison with similar homes in the area
Home Values in the Area
Average Home Value in this Area
Purchase History
| Date | Buyer | Sale Price | Title Company |
|---|---|---|---|
| Oasis Richard | $792,500 | None Available | |
| Oasis Richard | $792,500 | None Available | |
| Hedman Ret | -- | -- | |
| Hedman Ret | -- | -- |
Source: Public Records
Mortgage History
| Date | Status | Borrower | Loan Amount |
|---|---|---|---|
| Open | Oasis Richard | $806,501 |
Source: Public Records
Tax History Compared to Growth
Tax History
| Year | Tax Paid | Tax Assessment Tax Assessment Total Assessment is a certain percentage of the fair market value that is determined by local assessors to be the total taxable value of land and additions on the property. | Land | Improvement |
|---|---|---|---|---|
| 2025 | $6,916 | $1,166,300 | $887,100 | $279,200 |
| 2024 | $6,741 | $1,166,300 | $887,100 | $279,200 |
| 2023 | $6,695 | $1,166,300 | $887,100 | $279,200 |
| 2022 | $5,682 | $695,500 | $513,100 | $182,400 |
| 2021 | $5,689 | $695,500 | $513,100 | $182,400 |
| 2020 | $5,724 | $695,500 | $513,100 | $182,400 |
| 2019 | $6,148 | $666,100 | $513,100 | $153,000 |
| 2018 | $6,421 | $666,100 | $513,100 | $153,000 |
| 2017 | $6,388 | $666,100 | $513,100 | $153,000 |
| 2016 | $5,148 | $504,200 | $365,100 | $139,100 |
| 2015 | $5,097 | $504,200 | $365,100 | $139,100 |
| 2014 | $4,992 | $504,200 | $365,100 | $139,100 |
Source: Public Records
Map
Nearby Homes