35 Bennington Ct Stockbridge, GA 30281
Estimated Value: $362,974 - $429,000
4
Beds
3
Baths
3,000
Sq Ft
$127/Sq Ft
Est. Value
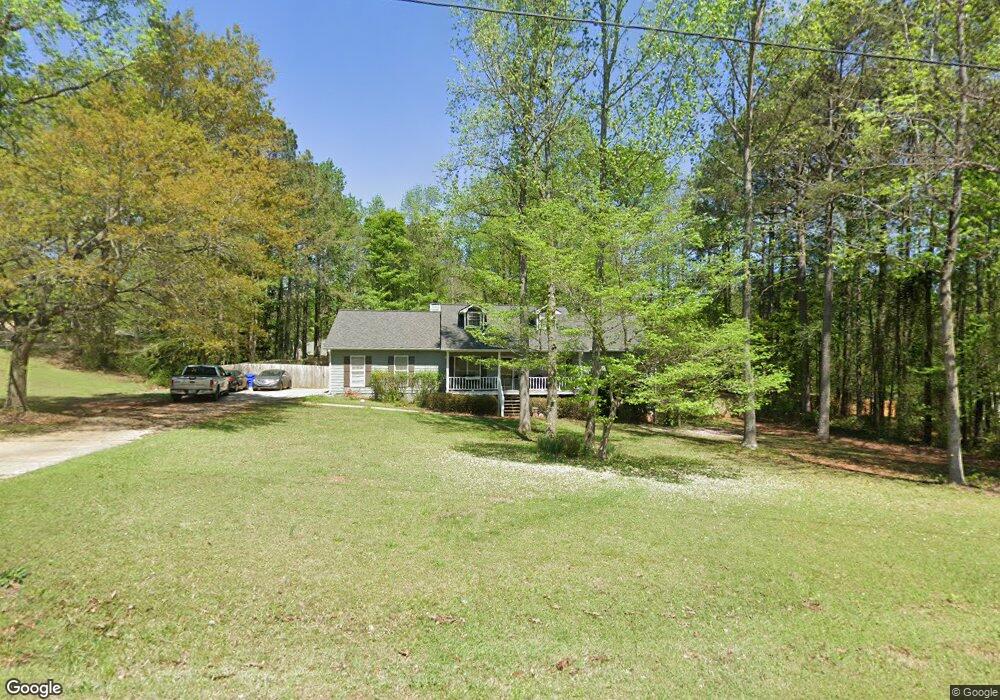
About This Home
This home is located at 35 Bennington Ct, Stockbridge, GA 30281 and is currently estimated at $382,244, approximately $127 per square foot. 35 Bennington Ct is a home located in Henry County with nearby schools including Woodland Elementary School, Woodland Middle School, and Woodland High School.
Ownership History
Date
Name
Owned For
Owner Type
Purchase Details
Closed on
Sep 24, 2010
Sold by
Mackusick David R and Mackusick Carol I
Bought by
Lough Marie P
Current Estimated Value
Home Financials for this Owner
Home Financials are based on the most recent Mortgage that was taken out on this home.
Original Mortgage
$132,925
Outstanding Balance
$88,041
Interest Rate
4.5%
Mortgage Type
FHA
Estimated Equity
$294,203
Create a Home Valuation Report for This Property
The Home Valuation Report is an in-depth analysis detailing your home's value as well as a comparison with similar homes in the area
Home Values in the Area
Average Home Value in this Area
Purchase History
| Date | Buyer | Sale Price | Title Company |
|---|---|---|---|
| Lough Marie P | $140,000 | -- |
Source: Public Records
Mortgage History
| Date | Status | Borrower | Loan Amount |
|---|---|---|---|
| Open | Lough Marie P | $132,925 |
Source: Public Records
Tax History
| Year | Tax Paid | Tax Assessment Tax Assessment Total Assessment is a certain percentage of the fair market value that is determined by local assessors to be the total taxable value of land and additions on the property. | Land | Improvement |
|---|---|---|---|---|
| 2025 | $2,239 | $152,156 | $14,000 | $138,156 |
| 2024 | $2,239 | $149,000 | $14,000 | $135,000 |
| 2023 | $5,372 | $139,000 | $10,800 | $128,200 |
| 2022 | $4,186 | $108,080 | $10,800 | $97,280 |
| 2021 | $3,635 | $93,720 | $10,800 | $82,920 |
| 2020 | $3,595 | $92,680 | $10,800 | $81,880 |
| 2019 | $3,354 | $86,400 | $10,800 | $75,600 |
| 2018 | $3,109 | $80,000 | $10,000 | $70,000 |
| 2016 | $2,823 | $72,560 | $8,000 | $64,560 |
| 2015 | $2,183 | $54,200 | $7,200 | $47,000 |
| 2014 | $2,158 | $52,920 | $6,000 | $46,920 |
Source: Public Records
Map
Nearby Homes
- 195 Bennington Dr
- 1468 Harlequin Way
- 1009 Moseley Rd
- 1476 Harlequin Way
- 1493 Harlequin Way
- 230 Moseley Crossing Dr
- 1549 Harlequin Way
- 1548 Harlequin Way
- 315 Rugged Creek Dr
- 400 Moseley Rd
- 725 Whitman Ln
- 5 Hearthstone Dr
- 676 Whitman Ln
- 672 Whitman Ln
- 264 Montgomery Dr
- 668 Whitman Ln
- 664 Whitman Ln
- 663 Whitman Ln
- 656 Whitman Ln
- 659 Whitman Ln
- 45 Bennington Ct Unit 3
- 25 Bennington Ct
- 160 Bennington Dr
- 30 Bennington Ct
- 150 Bennington Dr
- 180 Bennington Dr
- 40 Bennington Ct
- 55 Bennington Ct Unit 3
- 55 Bennington Ct Unit 21
- 20 Bennington Ct
- 50 Bennington Ct
- 140 Bennington Dr
- 190 Bennington Dr
- 100 Bennington Dr
- 60 Bennington Ct
- 65 Bennington Ct
- 960 Moseley Rd Unit 3
- 940 Moseley Rd Unit 3
- 155 Bennington Dr
- 165 Bennington Dr Unit 1
Your Personal Tour Guide
Ask me questions while you tour the home.