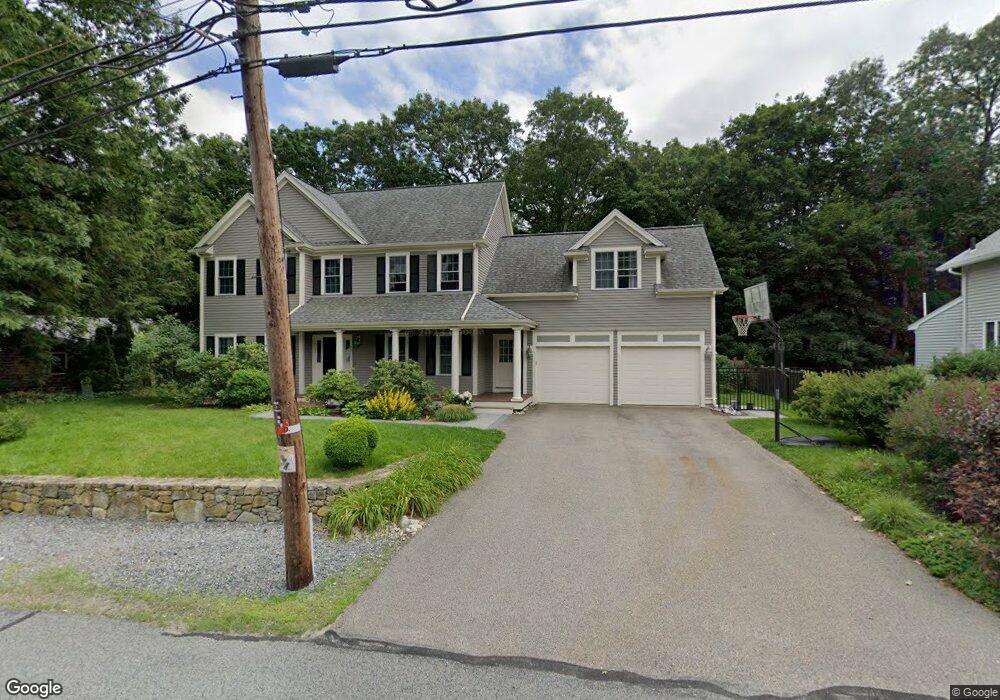
35 Border Rd Natick, MA 01760
Estimated Value: $1,322,381 - $1,553,000
4
Beds
3
Baths
2,886
Sq Ft
$500/Sq Ft
Est. Value
About This Home
This home is located at 35 Border Rd, Natick, MA 01760 and is currently estimated at $1,443,845, approximately $500 per square foot. 35 Border Rd is a home located in Middlesex County with nearby schools including Natick High School, Lilja Elementary School, and Wilson Middle School.
Ownership History
Date
Name
Owned For
Owner Type
Purchase Details
Closed on
May 2, 2011
Sold by
Black Jonathan and Black Jessica
Bought by
Stopfkuchen-Evans M E and Evans Sally Anne
Current Estimated Value
Home Financials for this Owner
Home Financials are based on the most recent Mortgage that was taken out on this home.
Original Mortgage
$500,000
Outstanding Balance
$345,550
Interest Rate
4.76%
Mortgage Type
Purchase Money Mortgage
Estimated Equity
$1,098,295
Purchase Details
Closed on
Aug 22, 2005
Sold by
Baldini James J
Bought by
Black Jessica and Black Jonathan
Purchase Details
Closed on
Oct 22, 2004
Sold by
Mcgrath Arthur E and Mcgrath Sharon A
Bought by
Baldini James J
Home Financials for this Owner
Home Financials are based on the most recent Mortgage that was taken out on this home.
Original Mortgage
$565,000
Interest Rate
5.85%
Mortgage Type
Purchase Money Mortgage
Create a Home Valuation Report for This Property
The Home Valuation Report is an in-depth analysis detailing your home's value as well as a comparison with similar homes in the area
Home Values in the Area
Average Home Value in this Area
Purchase History
| Date | Buyer | Sale Price | Title Company |
|---|---|---|---|
| Stopfkuchen-Evans M E | $687,000 | -- | |
| Black Jessica | $799,900 | -- | |
| Baldini James J | $300,000 | -- |
Source: Public Records
Mortgage History
| Date | Status | Borrower | Loan Amount |
|---|---|---|---|
| Open | Stopfkuchen-Evans M E | $500,000 | |
| Previous Owner | Baldini James J | $565,000 |
Source: Public Records
Tax History
| Year | Tax Paid | Tax Assessment Tax Assessment Total Assessment is a certain percentage of the fair market value that is determined by local assessors to be the total taxable value of land and additions on the property. | Land | Improvement |
|---|---|---|---|---|
| 2025 | $13,718 | $1,147,000 | $415,100 | $731,900 |
| 2024 | $13,254 | $1,081,100 | $390,700 | $690,400 |
| 2023 | $12,349 | $977,000 | $376,000 | $601,000 |
| 2022 | $11,943 | $895,300 | $341,900 | $553,400 |
| 2021 | $4,265 | $841,200 | $322,300 | $518,900 |
| 2020 | $4,006 | $826,600 | $307,700 | $518,900 |
| 2019 | $10,506 | $826,600 | $307,700 | $518,900 |
| 2018 | $3,400 | $789,000 | $293,000 | $496,000 |
| 2017 | $3,178 | $736,100 | $249,100 | $487,000 |
| 2016 | $9,618 | $708,800 | $226,400 | $482,400 |
| 2015 | $9,235 | $668,200 | $226,400 | $441,800 |
Source: Public Records
Map
Nearby Homes
Your Personal Tour Guide
Ask me questions while you tour the home.