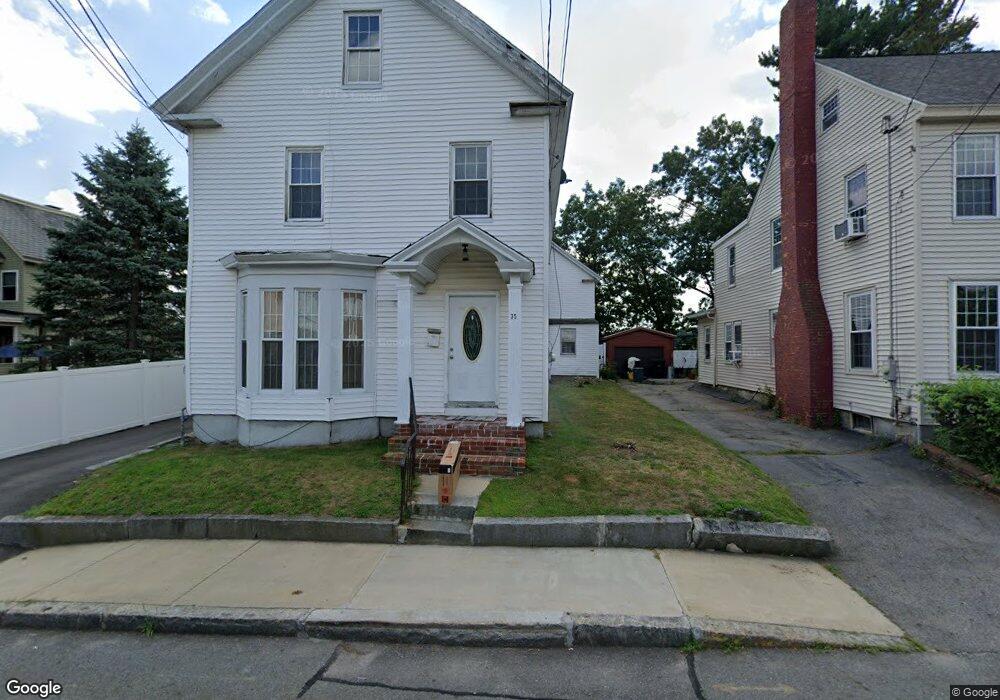
35 Bowers St Unit 3 Nashua, NH 03060
Downtown Nashua NeighborhoodEstimated Value: $568,000 - $748,000
3
Beds
1
Bath
850
Sq Ft
$791/Sq Ft
Est. Value
About This Home
This home is located at 35 Bowers St Unit 3, Nashua, NH 03060 and is currently estimated at $672,667, approximately $791 per square foot. 35 Bowers St Unit 3 is a home located in Hillsborough County with nearby schools including Dr. Norman W. Crisp Elementary School, Elm Street Middle School, and Nashua High School North.
Ownership History
Date
Name
Owned For
Owner Type
Purchase Details
Closed on
Dec 1, 2009
Sold by
Fnma
Bought by
Russell David C
Current Estimated Value
Home Financials for this Owner
Home Financials are based on the most recent Mortgage that was taken out on this home.
Original Mortgage
$500,000
Outstanding Balance
$325,142
Interest Rate
4.92%
Mortgage Type
Purchase Money Mortgage
Estimated Equity
$347,525
Purchase Details
Closed on
Sep 23, 2009
Sold by
Ramirez Sanche and Fnma
Bought by
Federal National Mortgage Association
Purchase Details
Closed on
Jun 16, 2000
Sold by
Telford Gary K and Telford Ramona S
Bought by
Ramiraz Sanche
Home Financials for this Owner
Home Financials are based on the most recent Mortgage that was taken out on this home.
Original Mortgage
$137,362
Interest Rate
8.24%
Mortgage Type
Purchase Money Mortgage
Create a Home Valuation Report for This Property
The Home Valuation Report is an in-depth analysis detailing your home's value as well as a comparison with similar homes in the area
Home Values in the Area
Average Home Value in this Area
Purchase History
| Date | Buyer | Sale Price | Title Company |
|---|---|---|---|
| Russell David C | $190,000 | -- | |
| Federal National Mortgage Association | $248,400 | -- | |
| Ramiraz Sanche | $145,000 | -- |
Source: Public Records
Mortgage History
| Date | Status | Borrower | Loan Amount |
|---|---|---|---|
| Open | Ramiraz Sanche | $327,000 | |
| Open | Ramiraz Sanche | $500,000 | |
| Previous Owner | Ramiraz Sanche | $238,000 | |
| Previous Owner | Ramiraz Sanche | $137,362 |
Source: Public Records
Tax History Compared to Growth
Tax History
| Year | Tax Paid | Tax Assessment Tax Assessment Total Assessment is a certain percentage of the fair market value that is determined by local assessors to be the total taxable value of land and additions on the property. | Land | Improvement |
|---|---|---|---|---|
| 2024 | $8,467 | $532,500 | $131,100 | $401,400 |
| 2023 | $8,256 | $452,900 | $104,900 | $348,000 |
| 2022 | $8,184 | $452,900 | $104,900 | $348,000 |
| 2021 | $6,713 | $289,100 | $69,900 | $219,200 |
| 2020 | $6,636 | $293,500 | $69,900 | $223,600 |
| 2019 | $6,387 | $293,500 | $69,900 | $223,600 |
| 2018 | $6,225 | $293,500 | $69,900 | $223,600 |
| 2017 | $6,798 | $263,600 | $63,600 | $200,000 |
| 2016 | $6,608 | $263,600 | $63,600 | $200,000 |
| 2015 | $6,466 | $263,600 | $63,600 | $200,000 |
| 2014 | $6,340 | $263,600 | $63,600 | $200,000 |
Source: Public Records
Map
Nearby Homes
- 24 E Otterson St
- 18 Harbor Ave Unit 208
- 2 Lyons St
- 5 Mulberry St
- 65 Allds St
- 13 Mulvanity St
- 8 Buck St Unit 10
- 15 Lovell St Unit 3
- 15 Lovell St Unit 7
- 15 Lovell St Unit 10
- 1 Circle Ave
- 22 Wilder St
- 38 Central St
- 30 Ledge St
- 4 Chase St
- 27 Fifield St Unit 13
- 4 Badger St
- 76 Gillis St
- 13 Sapphire Ln
- 11 Charles St