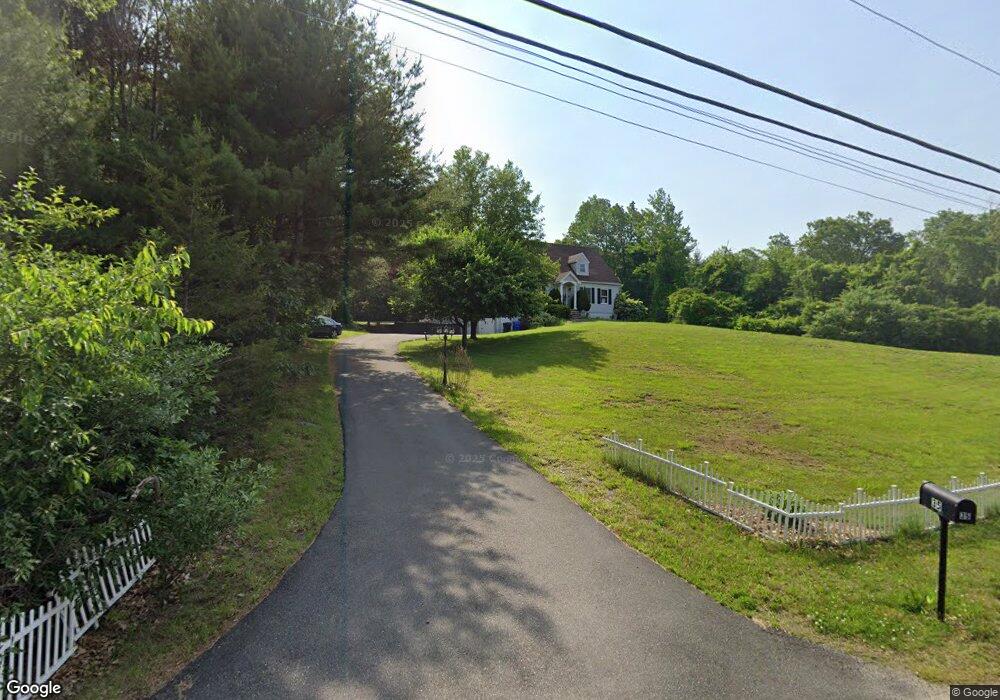
35 Boyd Rd Londonderry, NH 03053
Estimated Value: $673,000 - $807,000
3
Beds
3
Baths
2,254
Sq Ft
$324/Sq Ft
Est. Value
About This Home
This home is located at 35 Boyd Rd, Londonderry, NH 03053 and is currently estimated at $730,256, approximately $323 per square foot. 35 Boyd Rd is a home located in Rockingham County with nearby schools including Londonderry Middle School, Londonderry Senior High School, and Tabernacle Christian School.
Ownership History
Date
Name
Owned For
Owner Type
Purchase Details
Closed on
Feb 26, 2009
Sold by
Pontes Antoninette and Pontes Joseph
Bought by
Ramachandran Ravi and Rajagopal Beena
Current Estimated Value
Home Financials for this Owner
Home Financials are based on the most recent Mortgage that was taken out on this home.
Original Mortgage
$304,875
Interest Rate
5%
Purchase Details
Closed on
May 17, 2001
Sold by
Doucette Johnna and Doucette David
Bought by
Pontes Antoinette and Pontes Joseph
Home Financials for this Owner
Home Financials are based on the most recent Mortgage that was taken out on this home.
Original Mortgage
$242,550
Interest Rate
7.03%
Create a Home Valuation Report for This Property
The Home Valuation Report is an in-depth analysis detailing your home's value as well as a comparison with similar homes in the area
Home Values in the Area
Average Home Value in this Area
Purchase History
| Date | Buyer | Sale Price | Title Company |
|---|---|---|---|
| Ramachandran Ravi | $310,500 | -- | |
| Pontes Antoinette | $269,500 | -- |
Source: Public Records
Mortgage History
| Date | Status | Borrower | Loan Amount |
|---|---|---|---|
| Open | Pontes Antoinette | $280,141 | |
| Closed | Pontes Antoinette | $304,875 | |
| Previous Owner | Pontes Antoinette | $242,550 |
Source: Public Records
Tax History Compared to Growth
Tax History
| Year | Tax Paid | Tax Assessment Tax Assessment Total Assessment is a certain percentage of the fair market value that is determined by local assessors to be the total taxable value of land and additions on the property. | Land | Improvement |
|---|---|---|---|---|
| 2024 | $8,998 | $557,500 | $206,100 | $351,400 |
| 2023 | $8,464 | $540,800 | $206,100 | $334,700 |
| 2022 | $8,192 | $443,300 | $154,800 | $288,500 |
| 2021 | $8,148 | $443,300 | $154,800 | $288,500 |
| 2020 | $7,517 | $373,800 | $119,000 | $254,800 |
| 2019 | $7,248 | $373,800 | $119,000 | $254,800 |
| 2018 | $7,039 | $322,900 | $98,900 | $224,000 |
| 2017 | $6,978 | $322,900 | $98,900 | $224,000 |
| 2016 | $6,942 | $322,900 | $98,900 | $224,000 |
| 2015 | $6,787 | $322,900 | $98,900 | $224,000 |
| 2014 | $6,810 | $322,900 | $98,900 | $224,000 |
| 2011 | -- | $324,900 | $98,900 | $226,000 |
Source: Public Records
Map
Nearby Homes