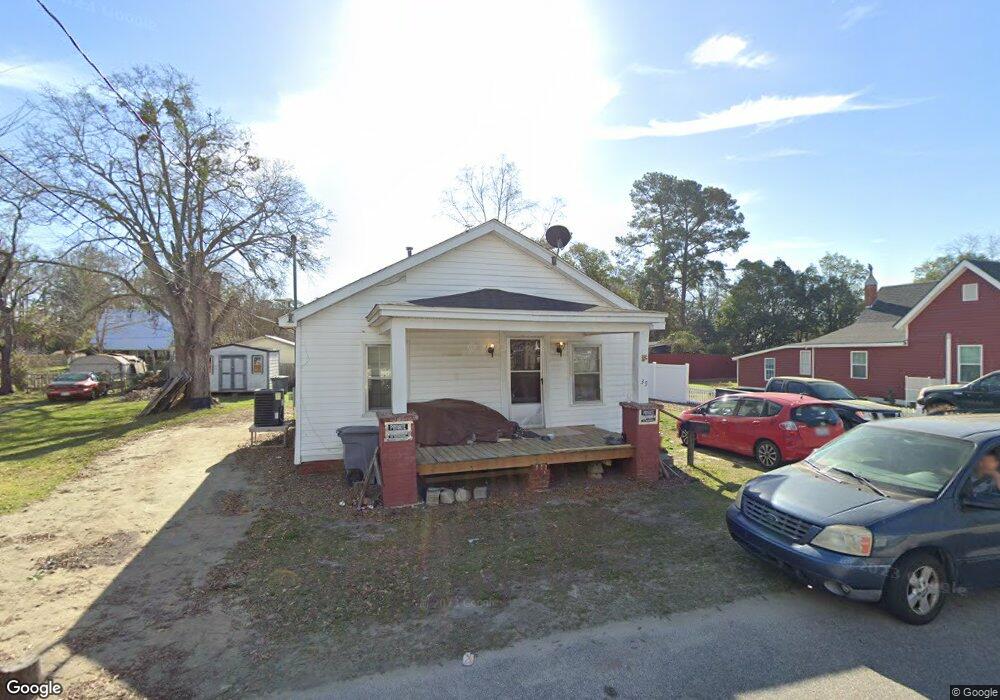
35 Bradford St Lumberton, NC 28358
Estimated Value: $37,000 - $75,000
2
Beds
1
Bath
718
Sq Ft
$90/Sq Ft
Est. Value
About This Home
This home is located at 35 Bradford St, Lumberton, NC 28358 and is currently estimated at $64,747, approximately $90 per square foot. 35 Bradford St is a home located in Robeson County with nearby schools including Tanglewood Elementary School, Parkton Elementary School, and L. Gilbert Carroll Middle School.
Ownership History
Date
Name
Owned For
Owner Type
Purchase Details
Closed on
Jul 15, 2024
Sold by
Select Choice Properties Llc
Bought by
Tolentino Santiago Jorge
Current Estimated Value
Purchase Details
Closed on
Oct 29, 2020
Sold by
Stewart Willie Thomas
Bought by
Select Choice Properties Llc
Home Financials for this Owner
Home Financials are based on the most recent Mortgage that was taken out on this home.
Original Mortgage
$129,500
Interest Rate
2.8%
Mortgage Type
Seller Take Back
Purchase Details
Closed on
Jan 1, 1993
Bought by
Stewart Willie T
Create a Home Valuation Report for This Property
The Home Valuation Report is an in-depth analysis detailing your home's value as well as a comparison with similar homes in the area
Home Values in the Area
Average Home Value in this Area
Purchase History
| Date | Buyer | Sale Price | Title Company |
|---|---|---|---|
| Tolentino Santiago Jorge | $31,500 | None Listed On Document | |
| Select Choice Properties Llc | -- | None Available | |
| Stewart Willie T | -- | -- |
Source: Public Records
Mortgage History
| Date | Status | Borrower | Loan Amount |
|---|---|---|---|
| Previous Owner | Select Choice Properties Llc | $129,500 |
Source: Public Records
Tax History Compared to Growth
Tax History
| Year | Tax Paid | Tax Assessment Tax Assessment Total Assessment is a certain percentage of the fair market value that is determined by local assessors to be the total taxable value of land and additions on the property. | Land | Improvement |
|---|---|---|---|---|
| 2025 | $439 | $47,800 | $5,500 | $42,300 |
| 2024 | $434 | $47,800 | $5,500 | $42,300 |
| 2023 | $310 | $31,400 | $5,000 | $26,400 |
| 2022 | $310 | $31,400 | $5,000 | $26,400 |
| 2021 | $310 | $31,400 | $5,000 | $26,400 |
| 2020 | $296 | $31,400 | $5,000 | $26,400 |
| 2018 | $302 | $24,400 | $5,000 | $19,400 |
| 2017 | $248 | $24,400 | $5,000 | $19,400 |
| 2016 | $248 | $24,400 | $5,000 | $19,400 |
| 2015 | $248 | $24,400 | $5,000 | $19,400 |
| 2014 | $248 | $24,400 | $5,000 | $19,400 |
Source: Public Records
Map
Nearby Homes