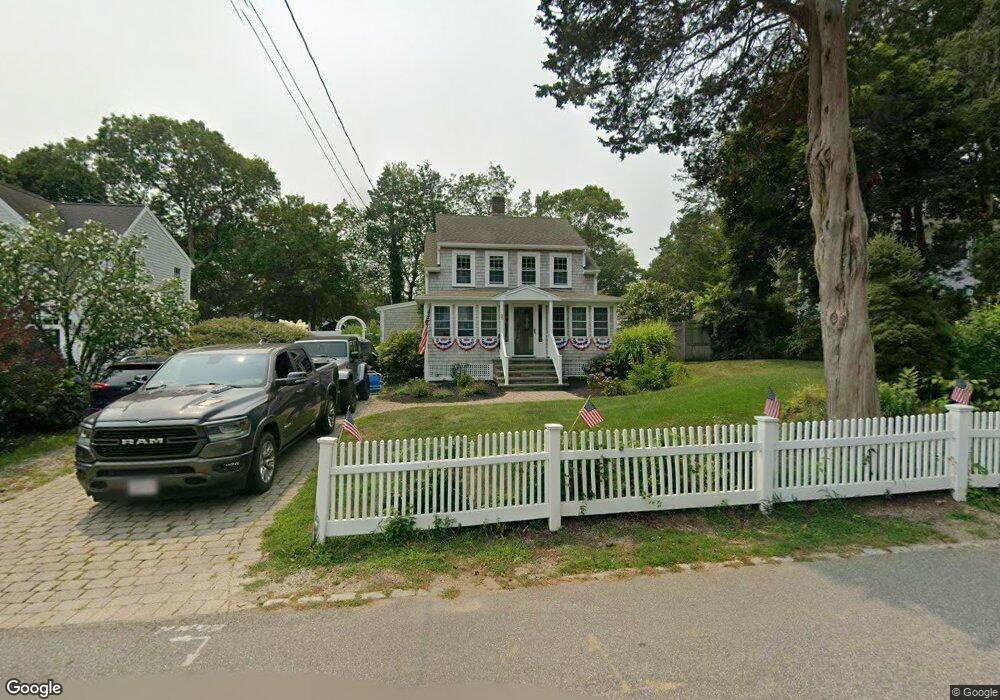
35 Carlton Rd Marshfield, MA 02050
Estimated Value: $820,707 - $975,000
2
Beds
2
Baths
1,402
Sq Ft
$631/Sq Ft
Est. Value
About This Home
This home is located at 35 Carlton Rd, Marshfield, MA 02050 and is currently estimated at $885,177, approximately $631 per square foot. 35 Carlton Rd is a home located in Plymouth County with nearby schools including Eames Way School, Furnace Brook Middle School, and Marshfield High School.
Ownership History
Date
Name
Owned For
Owner Type
Purchase Details
Closed on
May 13, 2020
Sold by
Leonard Paul K and Leonard Michelle
Bought by
Kessler Ryan G
Current Estimated Value
Home Financials for this Owner
Home Financials are based on the most recent Mortgage that was taken out on this home.
Original Mortgage
$479,200
Outstanding Balance
$422,773
Interest Rate
3.3%
Mortgage Type
New Conventional
Estimated Equity
$462,404
Purchase Details
Closed on
Aug 30, 2011
Sold by
Flaherty Evelyn A
Bought by
Leonard 3Rd Paul K and Leonard Michelle
Home Financials for this Owner
Home Financials are based on the most recent Mortgage that was taken out on this home.
Original Mortgage
$377,235
Interest Rate
4.5%
Mortgage Type
FHA
Purchase Details
Closed on
Sep 16, 1998
Sold by
Schwartz Fred V and Schwartz Carol B
Bought by
Flaherty Evelyn A
Create a Home Valuation Report for This Property
The Home Valuation Report is an in-depth analysis detailing your home's value as well as a comparison with similar homes in the area
Home Values in the Area
Average Home Value in this Area
Purchase History
| Date | Buyer | Sale Price | Title Company |
|---|---|---|---|
| Kessler Ryan G | $599,000 | None Available | |
| Leonard 3Rd Paul K | $415,000 | -- | |
| Leonard 3Rd Paul K | $415,000 | -- | |
| Flaherty Evelyn A | $222,500 | -- | |
| Flaherty Evelyn A | $222,500 | -- |
Source: Public Records
Mortgage History
| Date | Status | Borrower | Loan Amount |
|---|---|---|---|
| Open | Kessler Ryan G | $479,200 | |
| Closed | Kessler Ryan G | $479,200 | |
| Previous Owner | Leonard 3Rd Paul K | $377,235 |
Source: Public Records
Tax History Compared to Growth
Tax History
| Year | Tax Paid | Tax Assessment Tax Assessment Total Assessment is a certain percentage of the fair market value that is determined by local assessors to be the total taxable value of land and additions on the property. | Land | Improvement |
|---|---|---|---|---|
| 2025 | $7,081 | $715,300 | $262,500 | $452,800 |
| 2024 | $6,789 | $653,400 | $252,400 | $401,000 |
| 2023 | $6,454 | $570,100 | $232,200 | $337,900 |
| 2022 | $6,204 | $479,100 | $201,900 | $277,200 |
| 2021 | $6,180 | $468,500 | $201,900 | $266,600 |
| 2020 | $5,969 | $447,800 | $191,800 | $256,000 |
| 2019 | $5,139 | $437,200 | $191,800 | $245,400 |
| 2018 | $5,381 | $402,500 | $191,800 | $210,700 |
| 2017 | $5,229 | $381,100 | $181,700 | $199,400 |
| 2016 | $5,190 | $373,900 | $181,700 | $192,200 |
| 2015 | $4,969 | $373,900 | $181,700 | $192,200 |
| 2014 | $4,832 | $363,600 | $181,700 | $181,900 |
Source: Public Records
Map
Nearby Homes
- 43 Carlton Rd
- 27 Carlton Rd
- 42 Columbia Rd
- 38 Columbia Rd
- 38 Carlton Rd
- 42 Carlton Rd
- 34 Carlton Rd
- 51 Carlton Rd
- 23 Carlton Rd
- 28 Columbia Rd
- 50 Carlton Rd
- 24 Carlton Rd
- 29 Preston Terrace
- 24 Columbia Rd
- 27 Preston Terrace
- 25 Preston Terrace
- 58 Carlton Rd
- 45 Preston Terrace
- 9 Carlton Rd
- 21 Preston Terrace