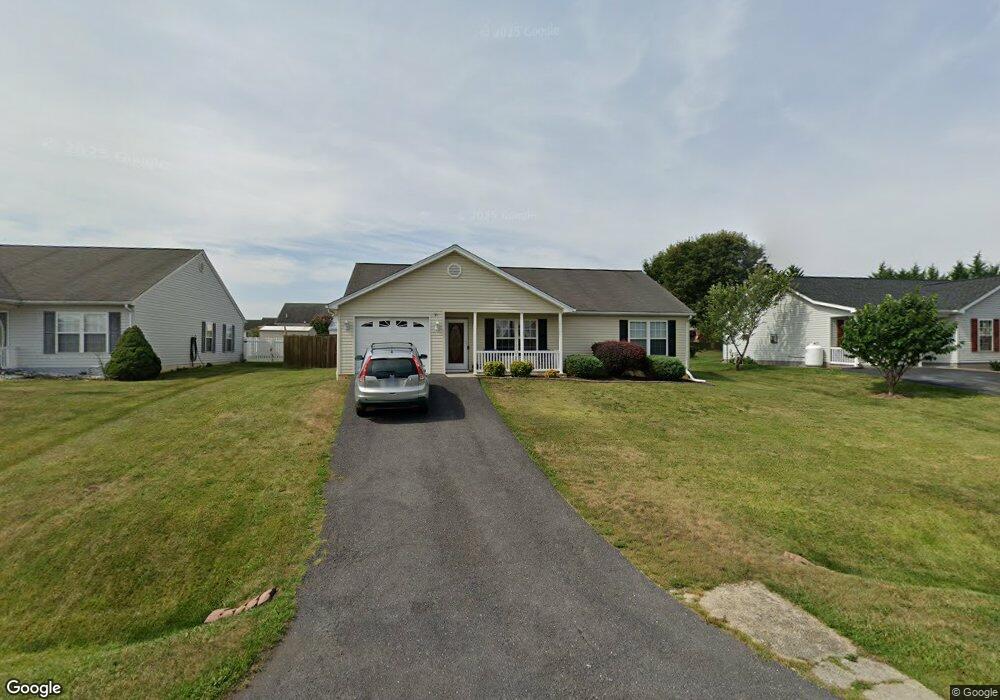
35 Carrollton Ct Weyers Cave, VA 24486
Estimated Value: $310,000 - $369,000
3
Beds
2
Baths
1,344
Sq Ft
$249/Sq Ft
Est. Value
About This Home
This home is located at 35 Carrollton Ct, Weyers Cave, VA 24486 and is currently estimated at $334,245, approximately $248 per square foot. 35 Carrollton Ct is a home located in Augusta County with nearby schools including Edward G. Clymore Elementary School, S. Gordon Stewart Middle School, and Fort Defiance High School.
Ownership History
Date
Name
Owned For
Owner Type
Purchase Details
Closed on
Jan 6, 2011
Sold by
Thomas William J and Thomas Nancy G
Bought by
Bevins Susan W
Current Estimated Value
Home Financials for this Owner
Home Financials are based on the most recent Mortgage that was taken out on this home.
Original Mortgage
$153,450
Outstanding Balance
$103,814
Interest Rate
4.62%
Mortgage Type
New Conventional
Estimated Equity
$230,431
Purchase Details
Closed on
Aug 18, 2009
Sold by
U S Bank Na
Bought by
Thomas William J and Thomas Nancy G
Home Financials for this Owner
Home Financials are based on the most recent Mortgage that was taken out on this home.
Original Mortgage
$102,400
Interest Rate
6%
Mortgage Type
New Conventional
Purchase Details
Closed on
Mar 12, 2009
Sold by
Bello Ilse
Bought by
Us Bank Na
Create a Home Valuation Report for This Property
The Home Valuation Report is an in-depth analysis detailing your home's value as well as a comparison with similar homes in the area
Home Values in the Area
Average Home Value in this Area
Purchase History
| Date | Buyer | Sale Price | Title Company |
|---|---|---|---|
| Bevins Susan W | $170,500 | Valley Southern Title Ltd | |
| Thomas William J | $128,000 | Stewart Title | |
| Us Bank Na | $150,561 | None Available |
Source: Public Records
Mortgage History
| Date | Status | Borrower | Loan Amount |
|---|---|---|---|
| Open | Bevins Susan W | $153,450 | |
| Previous Owner | Thomas William J | $102,400 |
Source: Public Records
Tax History Compared to Growth
Tax History
| Year | Tax Paid | Tax Assessment Tax Assessment Total Assessment is a certain percentage of the fair market value that is determined by local assessors to be the total taxable value of land and additions on the property. | Land | Improvement |
|---|---|---|---|---|
| 2025 | $1,286 | $247,300 | $60,000 | $187,300 |
| 2024 | $1,286 | $247,300 | $60,000 | $187,300 |
| 2023 | $1,079 | $171,300 | $52,000 | $119,300 |
| 2022 | $1,079 | $171,300 | $52,000 | $119,300 |
| 2021 | $1,079 | $171,300 | $52,000 | $119,300 |
| 2020 | $1,079 | $171,300 | $52,000 | $119,300 |
| 2019 | $1,079 | $171,300 | $52,000 | $119,300 |
| 2018 | $995 | $157,882 | $52,000 | $105,882 |
| 2017 | $916 | $157,882 | $52,000 | $105,882 |
| 2016 | $916 | $157,882 | $52,000 | $105,882 |
| 2015 | $796 | $157,882 | $52,000 | $105,882 |
| 2014 | $796 | $157,882 | $52,000 | $105,882 |
| 2013 | $796 | $165,900 | $60,000 | $105,900 |
Source: Public Records
Map
Nearby Homes
- 32 Harper St
- 55 Wyer St
- 42 Clayton Ct
- 59 Autumn Bluff Dr
- 78 Autumn Bluff Dr
- 187 Houff Rd
- 0 Tbd Naked Creek Hollow Rd
- 72 Liberty St
- 734 Dices Spring Rd
- 00 Lee Hwy
- 0 Mt Holly Rd Unit VAWE2008956
- 3901 Lee Hwy
- 84 Overlook Ave
- 94 Dices Spring Rd
- 2368 Lee Hwy
- tbd Knightly Ln
- TBD Valley View Dr
- 145 Fort Defiance Rd
- 0 Dam Town Rd Unit 667981
- 81 Cedar Creek Ln
- 41 Carrollton Ct
- 31 Carrollton Ct
- 86 Lofton Dr
- 94 Lofton Dr
- 45 Carrollton Ct
- 23 Carrollton Ct
- 82 Lofton Dr
- 40 Carrollton Ct
- 100 Lofton Dr
- 34 Carrollton Ct
- 42 Carrollton Ct
- 26 Carrollton Ct
- 76 Lofton Dr
- 55 Carrollton Ct
- 17 Carrollton Ct
- 102 Lofton Dr
- 48 Carrollton Ct
- 22 Carrollton Ct
- 70 Lofton Dr
- 56 Millport Ct