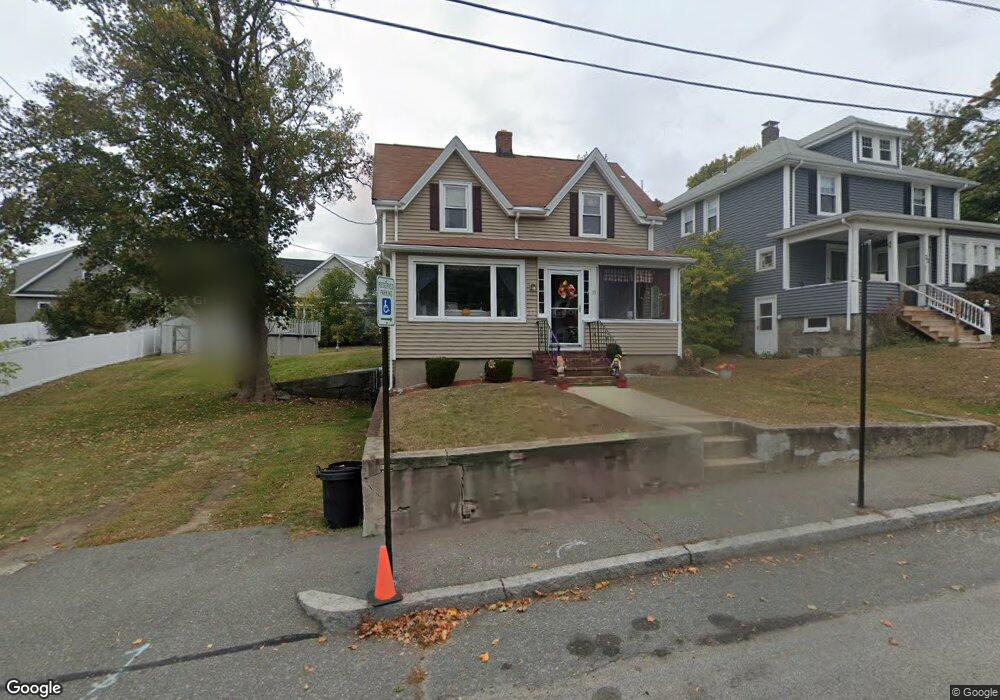
35 Carruth St Quincy, MA 02170
Quincy Center NeighborhoodEstimated Value: $615,000 - $679,741
3
Beds
1
Bath
1,069
Sq Ft
$611/Sq Ft
Est. Value
About This Home
This home is located at 35 Carruth St, Quincy, MA 02170 and is currently estimated at $653,685, approximately $611 per square foot. 35 Carruth St is a home located in Norfolk County with nearby schools including Merrymount Elementary School, Central Middle School, and North Quincy High School.
Ownership History
Date
Name
Owned For
Owner Type
Purchase Details
Closed on
Jul 23, 2021
Sold by
Lord Robert B and Lord Denise M
Bought by
Lord Ft
Current Estimated Value
Purchase Details
Closed on
Oct 20, 1976
Bought by
Lord Robert B
Create a Home Valuation Report for This Property
The Home Valuation Report is an in-depth analysis detailing your home's value as well as a comparison with similar homes in the area
Home Values in the Area
Average Home Value in this Area
Purchase History
We collect this data history from publicly available records. To have your information removed, we recommend requesting removal directly through your county’s website.
| Date | Buyer | Sale Price | Title Company |
|---|---|---|---|
| Lord Ft | -- | None Available | |
| Lord Robert B | -- | -- |
Source: Public Records
Mortgage History
We collect this data history from publicly available records. To have your information removed, we recommend requesting removal directly through your county’s website.
| Date | Status | Borrower | Loan Amount |
|---|---|---|---|
| Previous Owner | Lord Robert B | $17,000 | |
| Previous Owner | Lord Robert B | $10,000 |
Source: Public Records
Tax History
| Year | Tax Paid | Tax Assessment Tax Assessment Total Assessment is a certain percentage of the fair market value that is determined by local assessors to be the total taxable value of land and additions on the property. | Land | Improvement |
|---|---|---|---|---|
| 2025 | $7,060 | $612,300 | $389,100 | $223,200 |
| 2024 | $6,799 | $603,300 | $389,100 | $214,200 |
| 2023 | $6,384 | $573,600 | $370,900 | $202,700 |
| 2022 | $5,904 | $492,800 | $297,900 | $194,900 |
| 2021 | $5,708 | $470,200 | $297,900 | $172,300 |
| 2020 | $5,610 | $451,300 | $297,900 | $153,400 |
| 2019 | $5,395 | $429,900 | $278,800 | $151,100 |
| 2018 | $5,201 | $389,900 | $254,000 | $135,900 |
| 2017 | $5,383 | $379,900 | $254,000 | $125,900 |
| 2016 | $5,022 | $349,700 | $231,400 | $118,300 |
| 2015 | $4,659 | $319,100 | $210,900 | $108,200 |
| 2014 | $4,350 | $292,700 | $201,100 | $91,600 |
Source: Public Records
Map
Nearby Homes
- 999 Hancock St Unit 502
- 45 Oval Rd Unit 34
- 45 Oval Rd Unit 8
- 1025 Hancock St Unit 2P
- 1022 Hancock St Unit 112
- 77 Adams St Unit 611
- 77 Adams St Unit 610
- 200 Adams St
- 74 Butler Rd
- 44 Greenleaf St
- 20 Whitney Rd Unit 1
- 10 Edgemere Rd
- 131 S Central Ave
- 148 Presidents Ln Unit 1
- 45 Colonial Dr
- 365 Newport Ave Unit 303
- 43 Dixwell Ave
- 154 Glendale Rd Unit 2
- 165 Whitwell St
- 157 Beale St Unit 6
- 29 Carruth St
- 33 Carruth St
- 23 Carruth St
- 34 Carruth St
- 32 Gilmore St
- 38 Carruth St
- 30 Carruth St
- 41 Carruth St
- 28 Carruth St
- 42 Gilmore St
- 38 Gilmore St Unit D
- 38 Gilmore St
- 42 Gilmore St Unit B
- 42 Gilmore St Unit A
- 42 Gilmore St Unit G
- 42 Gilmore St Unit D
- 42 Gilmore St Unit F
- 42 Gilmore St Unit E
- 24 Carruth St Unit 24
- 19 Carruth St
Your Personal Tour Guide
Ask me questions while you tour the home.