Estimated Value: $478,000 - $649,000
2
Beds
1
Bath
975
Sq Ft
$604/Sq Ft
Est. Value
About This Home
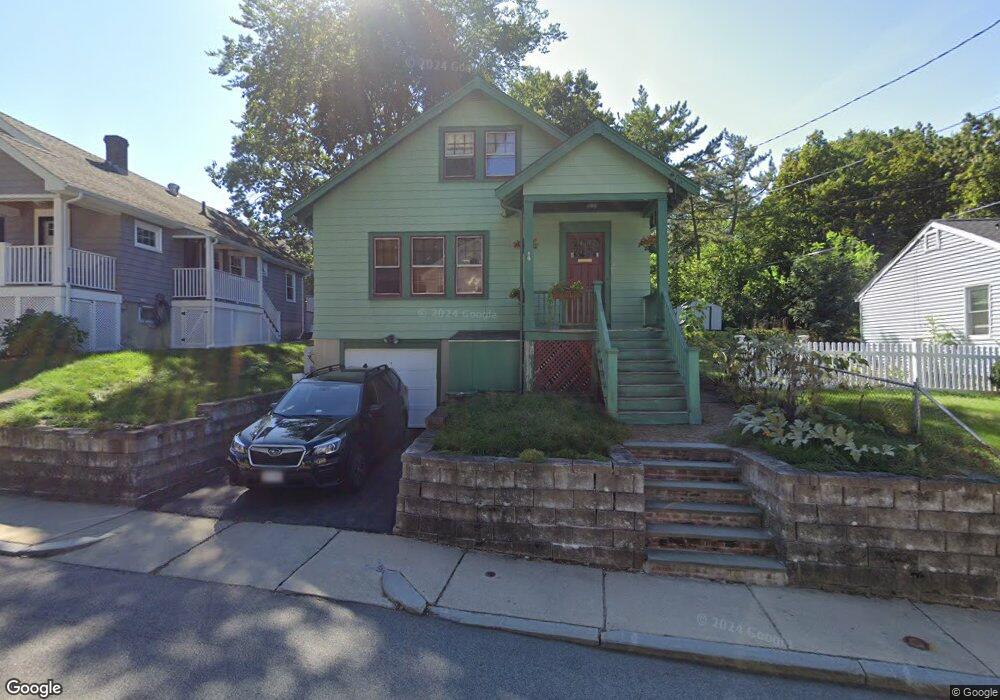
This home is located at 35 Cass St, West Roxbury, MA 02132 and is currently estimated at $588,585, approximately $603 per square foot. 35 Cass St is a home located in Suffolk County with nearby schools including St Theresa School, Catholic Memorial School, and The Roxbury Latin School.
Ownership History
Date
Name
Owned For
Owner Type
Purchase Details
Closed on
Nov 8, 2019
Sold by
Quagan Christine M
Bought by
Cass Street Ret
Current Estimated Value
Purchase Details
Closed on
Apr 29, 1994
Sold by
Johnson Elizabeth Est
Bought by
Grady Christine M
Home Financials for this Owner
Home Financials are based on the most recent Mortgage that was taken out on this home.
Original Mortgage
$96,000
Interest Rate
7.7%
Mortgage Type
Purchase Money Mortgage
Create a Home Valuation Report for This Property
The Home Valuation Report is an in-depth analysis detailing your home's value as well as a comparison with similar homes in the area
Home Values in the Area
Average Home Value in this Area
Purchase History
| Date | Buyer | Sale Price | Title Company |
|---|---|---|---|
| Cass Street Ret | -- | -- | |
| Grady Christine M | $120,000 | -- |
Source: Public Records
Mortgage History
| Date | Status | Borrower | Loan Amount |
|---|---|---|---|
| Previous Owner | Grady Christine M | $25,000 | |
| Previous Owner | Grady Christine M | $155,000 | |
| Previous Owner | Grady Christine M | $96,000 |
Source: Public Records
Tax History Compared to Growth
Tax History
| Year | Tax Paid | Tax Assessment Tax Assessment Total Assessment is a certain percentage of the fair market value that is determined by local assessors to be the total taxable value of land and additions on the property. | Land | Improvement |
|---|---|---|---|---|
| 2025 | $6,313 | $545,200 | $183,700 | $361,500 |
| 2024 | $5,575 | $511,500 | $190,100 | $321,400 |
| 2023 | $5,494 | $511,500 | $190,100 | $321,400 |
| 2022 | $5,059 | $465,000 | $172,800 | $292,200 |
| 2021 | $4,608 | $431,900 | $164,600 | $267,300 |
| 2020 | $4,356 | $412,500 | $153,300 | $259,200 |
| 2019 | $4,104 | $389,400 | $125,100 | $264,300 |
| 2018 | $3,777 | $360,400 | $125,100 | $235,300 |
| 2017 | $3,777 | $356,700 | $125,100 | $231,600 |
| 2016 | $3,702 | $336,500 | $125,100 | $211,400 |
| 2015 | $3,753 | $309,900 | $133,900 | $176,000 |
| 2014 | $3,644 | $289,700 | $133,900 | $155,800 |
Source: Public Records
Map
Nearby Homes
- 63 Johnson St
- 2231 Centre St
- 12 Bronx Rd
- 27-29 Temple St
- 14 Sanborn Ave
- 1216 Vfw Pkwy Unit 40
- 1214 Vfw Pkwy Unit 30
- 1214 Vfw Pkwy Unit 37
- 340 Baker St Unit 1
- 28 Dow Rd
- 425 Lagrange St Unit 203
- 348 Lagrange St
- 59 Chesbrough Rd
- 54 Sturges Rd
- 73 Dent St Unit 1
- 183 Temple St
- 105 Chesbrough Rd
- 80 Caledonian Ave
- 231 Lagrange St
- 539 Lagrange St