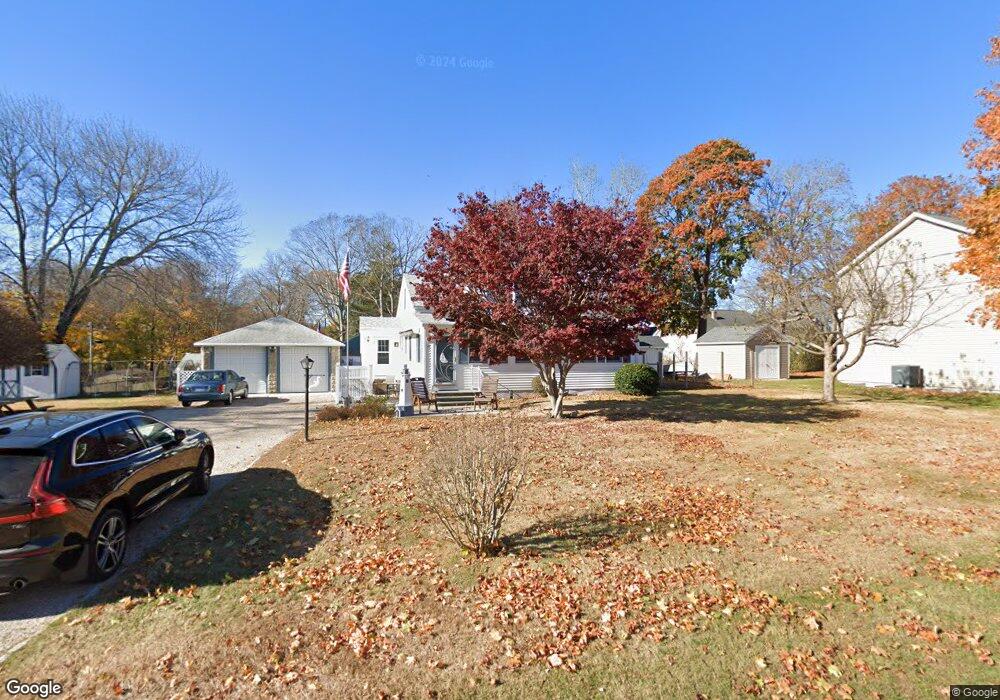
35 Central Ave Niantic, CT 06357
Niantic NeighborhoodEstimated Value: $483,665 - $598,000
2
Beds
2
Baths
1,390
Sq Ft
$391/Sq Ft
Est. Value
About This Home
This home is located at 35 Central Ave, Niantic, CT 06357 and is currently estimated at $542,916, approximately $390 per square foot. 35 Central Ave is a home located in New London County with nearby schools including East Lyme Middle School, East Lyme High School, and The Light House Voc-Ed Center.
Ownership History
Date
Name
Owned For
Owner Type
Purchase Details
Closed on
Nov 30, 1993
Sold by
Carlson Edna M Est
Bought by
Zitzkat Donald A and Zitzkat Virginia K
Current Estimated Value
Home Financials for this Owner
Home Financials are based on the most recent Mortgage that was taken out on this home.
Original Mortgage
$65,000
Interest Rate
6.72%
Mortgage Type
Purchase Money Mortgage
Create a Home Valuation Report for This Property
The Home Valuation Report is an in-depth analysis detailing your home's value as well as a comparison with similar homes in the area
Home Values in the Area
Average Home Value in this Area
Purchase History
| Date | Buyer | Sale Price | Title Company |
|---|---|---|---|
| Zitzkat Donald A | $96,000 | -- | |
| Zitzkat Donald A | $96,000 | -- |
Source: Public Records
Mortgage History
| Date | Status | Borrower | Loan Amount |
|---|---|---|---|
| Closed | Zitzkat Donald A | $65,000 |
Source: Public Records
Tax History
| Year | Tax Paid | Tax Assessment Tax Assessment Total Assessment is a certain percentage of the fair market value that is determined by local assessors to be the total taxable value of land and additions on the property. | Land | Improvement |
|---|---|---|---|---|
| 2025 | $5,994 | $213,990 | $97,930 | $116,060 |
| 2024 | $5,639 | $213,990 | $97,930 | $116,060 |
| 2023 | $5,324 | $213,990 | $97,930 | $116,060 |
| 2022 | $5,102 | $213,990 | $97,930 | $116,060 |
| 2021 | $5,027 | $176,330 | $93,520 | $82,810 |
| 2020 | $5,001 | $176,330 | $93,520 | $82,810 |
| 2019 | $4,971 | $176,330 | $93,520 | $82,810 |
| 2018 | $4,823 | $176,330 | $93,520 | $82,810 |
| 2017 | $4,613 | $176,330 | $93,520 | $82,810 |
| 2016 | $5,040 | $198,730 | $115,780 | $82,950 |
| 2015 | $4,911 | $198,730 | $115,780 | $82,950 |
| 2014 | $4,775 | $198,730 | $115,780 | $82,950 |
Source: Public Records
Map
Nearby Homes
- 127 Black Point Rd Unit 7
- 42 S Washington Ave
- 26 Mohawk Dr
- 36 Attawan Rd
- 43 Village Crossing Unit 43
- 468 Main St Unit 318
- 468 Main St Unit 111
- 47 Village Crossing Unit 47
- 46 Village Crossing Unit 46
- 19 Sapia Dr
- 12 Spinnaker Dr
- 97 W Main St Unit 36
- 61 Whitecap Rd
- 31 Regatta Dr
- 55 Corey Ln
- 185 Main St Unit 301
- 185 Main St Unit 305
- 43 Roxbury Ct
- 37 Stoneywood Dr
- 15 Griswold Rd
Your Personal Tour Guide
Ask me questions while you tour the home.