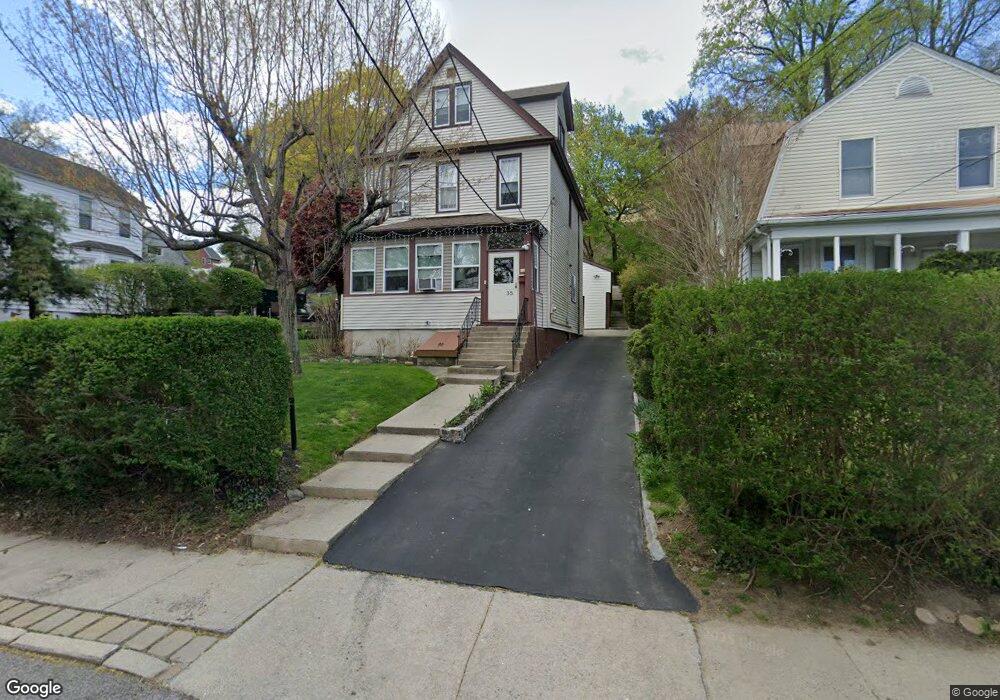
35 Clover St Yonkers, NY 10703
Northwest Yonkers NeighborhoodEstimated Value: $603,000 - $701,405
3
Beds
2
Baths
1,765
Sq Ft
$379/Sq Ft
Est. Value
About This Home
This home is located at 35 Clover St, Yonkers, NY 10703 and is currently estimated at $668,601, approximately $378 per square foot. 35 Clover St is a home located in Westchester County with nearby schools including St Anthony Catholic School and The School for Adaptive and Integrative Learning (SAIL) at Ferncliff Manor.
Ownership History
Date
Name
Owned For
Owner Type
Purchase Details
Closed on
Oct 10, 2000
Sold by
Sousa Mark V and Sousa Colleen A
Bought by
Sousa Mark
Current Estimated Value
Create a Home Valuation Report for This Property
The Home Valuation Report is an in-depth analysis detailing your home's value as well as a comparison with similar homes in the area
Home Values in the Area
Average Home Value in this Area
Purchase History
| Date | Buyer | Sale Price | Title Company |
|---|---|---|---|
| Sousa Mark | -- | -- |
Source: Public Records
Tax History Compared to Growth
Tax History
| Year | Tax Paid | Tax Assessment Tax Assessment Total Assessment is a certain percentage of the fair market value that is determined by local assessors to be the total taxable value of land and additions on the property. | Land | Improvement |
|---|---|---|---|---|
| 2024 | $1,307 | $7,259 | $5,200 | $2,059 |
| 2023 | $1,311 | $7,259 | $5,200 | $2,059 |
| 2022 | $1,291 | $7,259 | $5,200 | $2,059 |
| 2021 | $5,353 | $7,259 | $5,200 | $2,059 |
| 2020 | $5,260 | $7,259 | $5,200 | $2,059 |
| 2019 | $6,437 | $7,259 | $5,200 | $2,059 |
| 2018 | $4,787 | $7,259 | $5,200 | $2,059 |
| 2017 | -- | $8,200 | $5,200 | $3,000 |
| 2016 | $6,366 | $8,200 | $5,200 | $3,000 |
| 2015 | -- | $8,200 | $5,200 | $3,000 |
| 2014 | -- | $8,200 | $5,200 | $3,000 |
| 2013 | -- | $9,800 | $5,200 | $4,600 |
Source: Public Records
Map
Nearby Homes
- 664 Bellevue Ave N
- 678 Bellevue Ave N
- 22 Truman Ave
- 6 Regina Place
- 98 Dehaven Dr Unit 1F
- 167 Bolmer Ave
- 120 Dehaven Dr Unit 432
- 120 Dehaven Dr Unit 436
- 120 De Haven Dr Unit 629
- 120 Dehaven Dr Unit 234
- 8 Gerri Ln
- 18 South Cir
- 3 Cascade Terrace Unit 1E
- 48 Dehaven Dr Unit 2E
- 824 Saw Mill River Rd
- 44 Dehaven Dr Unit 1D
- 169 Bretton Rd
- 26 Dehaven Dr Unit 2D
- 451 Bellevue Ave
- 28 Dehaven Dr Unit 1E