35 Courville Rd Auburn, MA 01501
Stoneville NeighborhoodEstimated Value: $337,000 - $412,000
2
Beds
1
Bath
976
Sq Ft
$375/Sq Ft
Est. Value
About This Home
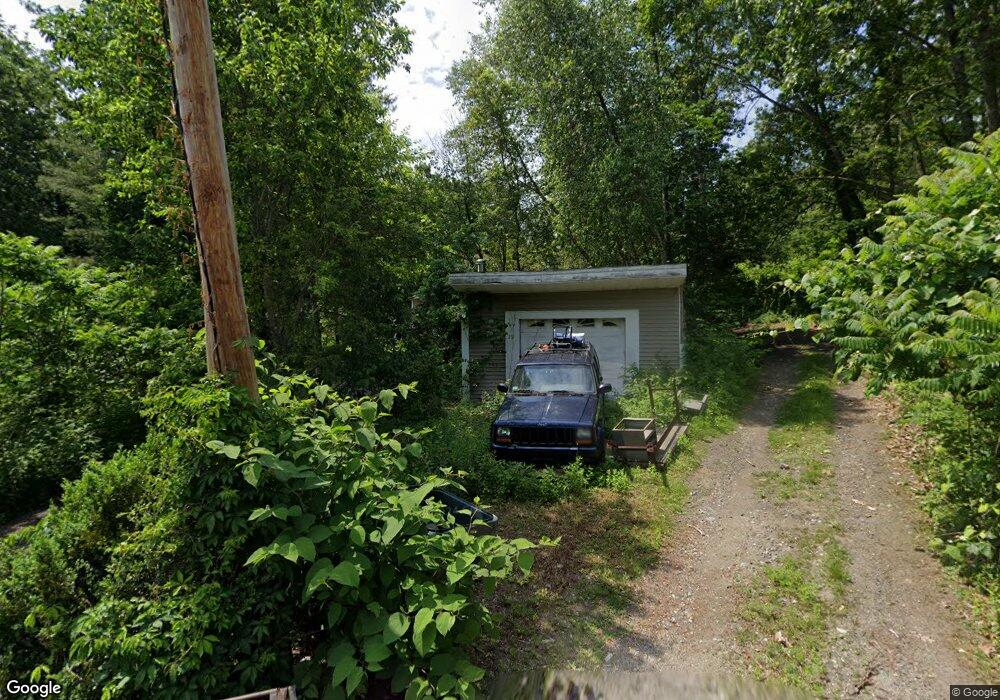
This home is located at 35 Courville Rd, Auburn, MA 01501 and is currently estimated at $365,618, approximately $374 per square foot. 35 Courville Rd is a home located in Worcester County with nearby schools including Auburn Senior High School and Shrewsbury Montessori School - Auburn Campus.
Ownership History
Date
Name
Owned For
Owner Type
Purchase Details
Closed on
Mar 7, 2016
Sold by
Hsbc Bank Usa Na Tr
Bought by
Perritt Michel
Current Estimated Value
Purchase Details
Closed on
Nov 20, 2015
Sold by
Frase David
Bought by
Hsbc Bank Usa Na Tr
Purchase Details
Closed on
Feb 13, 2007
Sold by
35 Courville Road T and Paquette S
Bought by
Frase David K
Home Financials for this Owner
Home Financials are based on the most recent Mortgage that was taken out on this home.
Original Mortgage
$207,900
Interest Rate
6.22%
Mortgage Type
Purchase Money Mortgage
Purchase Details
Closed on
Jun 27, 2006
Sold by
Vannguyen Don and Vannguyen R
Bought by
35 Courville Road T and Paquette S
Home Financials for this Owner
Home Financials are based on the most recent Mortgage that was taken out on this home.
Original Mortgage
$130,000
Interest Rate
6.59%
Mortgage Type
Purchase Money Mortgage
Create a Home Valuation Report for This Property
The Home Valuation Report is an in-depth analysis detailing your home's value as well as a comparison with similar homes in the area
Home Values in the Area
Average Home Value in this Area
Purchase History
| Date | Buyer | Sale Price | Title Company |
|---|---|---|---|
| Perritt Michel | $54,639 | -- | |
| Hsbc Bank Usa Na Tr | $118,958 | -- | |
| Frase David K | $231,000 | -- | |
| 35 Courville Road T | $98,000 | -- |
Source: Public Records
Mortgage History
| Date | Status | Borrower | Loan Amount |
|---|---|---|---|
| Previous Owner | Frase David K | $207,900 | |
| Previous Owner | 35 Courville Road T | $130,000 |
Source: Public Records
Tax History Compared to Growth
Tax History
| Year | Tax Paid | Tax Assessment Tax Assessment Total Assessment is a certain percentage of the fair market value that is determined by local assessors to be the total taxable value of land and additions on the property. | Land | Improvement |
|---|---|---|---|---|
| 2025 | $3,928 | $274,900 | $121,500 | $153,400 |
| 2024 | $3,762 | $252,000 | $116,500 | $135,500 |
| 2023 | $3,718 | $234,100 | $105,900 | $128,200 |
| 2022 | $3,525 | $209,600 | $105,900 | $103,700 |
| 2021 | $4,082 | $225,000 | $93,500 | $131,500 |
| 2020 | $4,022 | $223,700 | $93,500 | $130,200 |
| 2019 | $3,802 | $206,400 | $92,600 | $113,800 |
| 2018 | $3,282 | $193,600 | $86,600 | $107,000 |
| 2017 | $3,404 | $185,600 | $78,600 | $107,000 |
| 2016 | $3,171 | $175,300 | $81,600 | $93,700 |
| 2015 | $2,919 | $169,100 | $81,600 | $87,500 |
| 2014 | $2,939 | $170,000 | $77,600 | $92,400 |
Source: Public Records
Map
Nearby Homes
- 27 Havana Rd
- 2 Keen St
- 315 Stafford St
- 177 Oxford St N
- 176 Boyce St
- 177 Boyce St
- 1-9 Helens Way
- 19-20 Williams St
- 5 Commonwealth Ave
- 25 Vinal St Unit 26
- 25 Vinal St Unit 29
- 25 Vinal St Unit 30
- 53 James St
- 8 Shirley St
- 40 Ludlow St
- 4 S Edlin St
- 34 Rockland Rd
- 35 Genessee St Unit I
- 24 Ludlow St
- 170 Stafford St