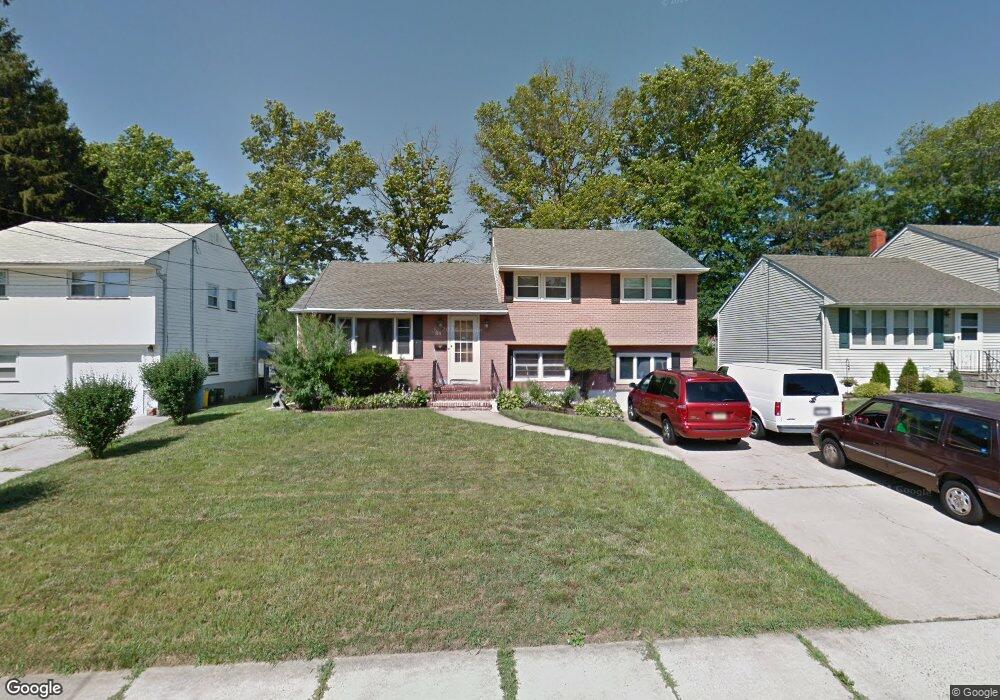
35 Dawes Ave Ewing, NJ 08638
Prospect NeighborhoodEstimated Value: $380,276 - $460,000
Studio
--
Bath
1,694
Sq Ft
$245/Sq Ft
Est. Value
About This Home
This home is located at 35 Dawes Ave, Ewing, NJ 08638 and is currently estimated at $414,819, approximately $244 per square foot. 35 Dawes Ave is a home located in Mercer County with nearby schools including Ewing High School, Paul Robeson Charter School For The Humanities, and Trenton Stem-To-Civics Charter School.
Ownership History
Date
Name
Owned For
Owner Type
Purchase Details
Closed on
Sep 10, 2001
Sold by
Veltz Marie
Bought by
Silbert Francis and Brown Alex
Current Estimated Value
Home Financials for this Owner
Home Financials are based on the most recent Mortgage that was taken out on this home.
Original Mortgage
$124,000
Outstanding Balance
$46,130
Interest Rate
6.98%
Estimated Equity
$368,689
Purchase Details
Closed on
Aug 20, 1998
Sold by
Safir Alan
Bought by
Veltz Marie
Home Financials for this Owner
Home Financials are based on the most recent Mortgage that was taken out on this home.
Original Mortgage
$94,400
Interest Rate
6.9%
Create a Home Valuation Report for This Property
The Home Valuation Report is an in-depth analysis detailing your home's value as well as a comparison with similar homes in the area
Home Values in the Area
Average Home Value in this Area
Purchase History
| Date | Buyer | Sale Price | Title Company |
|---|---|---|---|
| Silbert Francis | $155,000 | -- | |
| Veltz Marie | $118,000 | -- |
Source: Public Records
Mortgage History
| Date | Status | Borrower | Loan Amount |
|---|---|---|---|
| Open | Silbert Francis | $124,000 | |
| Previous Owner | Veltz Marie | $94,400 |
Source: Public Records
Tax History
| Year | Tax Paid | Tax Assessment Tax Assessment Total Assessment is a certain percentage of the fair market value that is determined by local assessors to be the total taxable value of land and additions on the property. | Land | Improvement |
|---|---|---|---|---|
| 2025 | $7,186 | $182,700 | $57,000 | $125,700 |
| 2024 | $6,754 | $182,700 | $57,000 | $125,700 |
Source: Public Records
Map
Nearby Homes
- 32 Stoneham Rd
- 7 Mabel St
- 41 Poland St
- 16 Bittersweet Rd
- 33 Sherbrooke Rd
- 1600 13th St
- 2302 Columbia Ave
- 56 Sherbrooke Rd
- 137 Ardsley Ave
- 17 Hillman Ave
- 24 Keswick Ave
- 91 Groveland Ave
- 124 Hawthorne Ave
- 43 Iowana Ave
- 50 Groveland Ave
- 200 Upland Ave
- 138 Tulip Ln
- 40 Arden Ave
- 35 Rosedale Ave
- 23 Sundew Dr
Your Personal Tour Guide
Ask me questions while you tour the home.