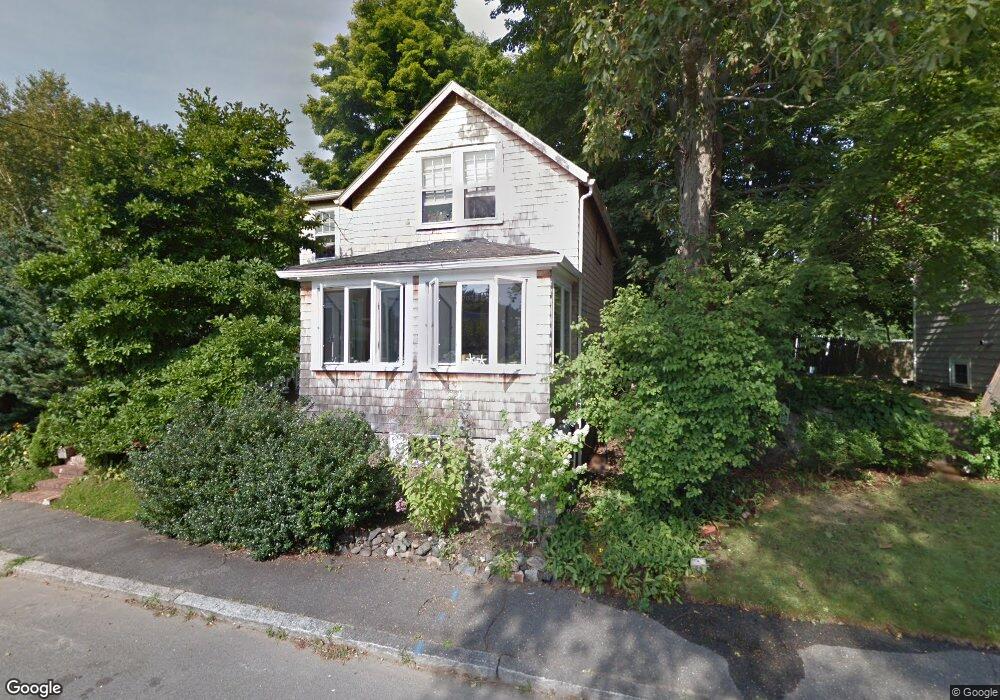
35 Devereux St Marblehead, MA 01945
Estimated Value: $651,000 - $829,000
3
Beds
2
Baths
1,321
Sq Ft
$569/Sq Ft
Est. Value
About This Home
This home is located at 35 Devereux St, Marblehead, MA 01945 and is currently estimated at $752,228, approximately $569 per square foot. 35 Devereux St is a home located in Essex County with nearby schools including Marblehead High School, Devereux School, and Tower School.
Ownership History
Date
Name
Owned For
Owner Type
Purchase Details
Closed on
Mar 23, 2006
Sold by
Georges James
Bought by
Hitchcock Sarah Payson
Current Estimated Value
Home Financials for this Owner
Home Financials are based on the most recent Mortgage that was taken out on this home.
Original Mortgage
$250,000
Outstanding Balance
$142,206
Interest Rate
6.28%
Mortgage Type
Purchase Money Mortgage
Estimated Equity
$610,022
Create a Home Valuation Report for This Property
The Home Valuation Report is an in-depth analysis detailing your home's value as well as a comparison with similar homes in the area
Home Values in the Area
Average Home Value in this Area
Purchase History
| Date | Buyer | Sale Price | Title Company |
|---|---|---|---|
| Hitchcock Sarah Payson | $380,000 | -- | |
| Hitchcock Sarah Payson | $380,000 | -- |
Source: Public Records
Mortgage History
| Date | Status | Borrower | Loan Amount |
|---|---|---|---|
| Open | Hitchcock Sarah Payson | $250,000 | |
| Closed | Hitchcock Sarah Payson | $250,000 |
Source: Public Records
Tax History Compared to Growth
Tax History
| Year | Tax Paid | Tax Assessment Tax Assessment Total Assessment is a certain percentage of the fair market value that is determined by local assessors to be the total taxable value of land and additions on the property. | Land | Improvement |
|---|---|---|---|---|
| 2025 | $6,557 | $724,500 | $532,400 | $192,100 |
| 2024 | $6,569 | $733,100 | $544,200 | $188,900 |
| 2023 | $6,364 | $636,400 | $479,100 | $157,300 |
| 2022 | $6,090 | $578,900 | $425,900 | $153,000 |
| 2021 | $5,775 | $554,200 | $402,200 | $152,000 |
| 2020 | $5,593 | $538,300 | $402,200 | $136,100 |
| 2019 | $5,400 | $502,800 | $366,700 | $136,100 |
| 2018 | $5,281 | $479,200 | $343,100 | $136,100 |
| 2017 | $5,145 | $467,300 | $331,200 | $136,100 |
| 2016 | $4,925 | $443,700 | $307,600 | $136,100 |
| 2015 | $4,392 | $396,400 | $260,300 | $136,100 |
| 2014 | $4,098 | $369,500 | $236,600 | $132,900 |
Source: Public Records
Map
Nearby Homes
- 282 Pleasant St
- 6 Higgins Rd
- 70 Maverick St
- 41 Rowland St
- 4 Cross St Unit 1
- 29 Village St Unit 1
- 41 Atlantic Ave Unit 1
- 148-150 Pleasant St Unit 2
- 16 Shorewood Rd
- 290 Washington St
- 100 Village St
- 24 Maple St
- 56 Hawkes St
- 21 Reed St
- 5 Orchard Cir
- 55 Brackett Place Unit B
- 9 Skinner's Path Unit 9
- 7 Waldron Ct
- 197A W Shore Dr Unit A
- 409 Atlantic Ave Unit 409