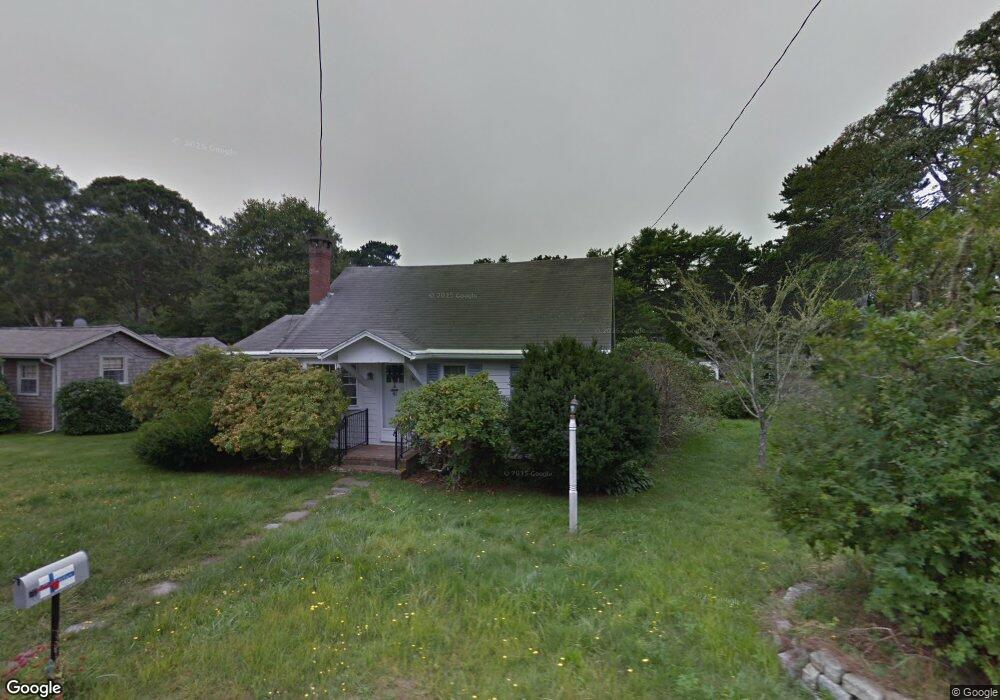
35 Division St Dennis Port, MA 02639
Dennis Port NeighborhoodEstimated Value: $335,000 - $648,000
3
Beds
1
Bath
1,149
Sq Ft
$451/Sq Ft
Est. Value
About This Home
This home is located at 35 Division St, Dennis Port, MA 02639 and is currently estimated at $518,443, approximately $451 per square foot. 35 Division St is a home located in Barnstable County with nearby schools including Dennis-Yarmouth Regional High School and St. Pius X. School.
Ownership History
Date
Name
Owned For
Owner Type
Purchase Details
Closed on
Jun 12, 2025
Sold by
Heikkila Glenn R and Heikkila Gary R
Bought by
Sullivan James B and Sullivan Susan E
Current Estimated Value
Home Financials for this Owner
Home Financials are based on the most recent Mortgage that was taken out on this home.
Original Mortgage
$287,300
Outstanding Balance
$286,052
Interest Rate
6.76%
Mortgage Type
Purchase Money Mortgage
Estimated Equity
$232,391
Create a Home Valuation Report for This Property
The Home Valuation Report is an in-depth analysis detailing your home's value as well as a comparison with similar homes in the area
Home Values in the Area
Average Home Value in this Area
Purchase History
| Date | Buyer | Sale Price | Title Company |
|---|---|---|---|
| Sullivan James B | $338,000 | None Available |
Source: Public Records
Mortgage History
| Date | Status | Borrower | Loan Amount |
|---|---|---|---|
| Open | Sullivan James B | $287,300 |
Source: Public Records
Tax History Compared to Growth
Tax History
| Year | Tax Paid | Tax Assessment Tax Assessment Total Assessment is a certain percentage of the fair market value that is determined by local assessors to be the total taxable value of land and additions on the property. | Land | Improvement |
|---|---|---|---|---|
| 2025 | $2,106 | $486,300 | $181,300 | $305,000 |
| 2024 | $1,992 | $453,700 | $174,400 | $279,300 |
| 2023 | $2,025 | $433,700 | $158,500 | $275,200 |
| 2022 | $1,935 | $345,500 | $142,800 | $202,700 |
| 2021 | $1,810 | $300,200 | $140,000 | $160,200 |
| 2020 | $1,710 | $280,400 | $129,200 | $151,200 |
| 2019 | $6,153 | $261,900 | $126,700 | $135,200 |
| 2018 | $1,639 | $258,500 | $130,700 | $127,800 |
| 2017 | $5,391 | $248,400 | $120,600 | $127,800 |
| 2016 | $1,521 | $232,900 | $125,600 | $107,300 |
| 2015 | $1,491 | $232,900 | $125,600 | $107,300 |
| 2014 | $1,363 | $214,600 | $110,600 | $104,000 |
Source: Public Records
Map
Nearby Homes
- 26 Manning Rd
- 73 Division St
- 159 Center St Unit 22
- 3 Fairbanks Dr
- 148 Belmont Rd
- 12 Cross St
- 40 Willow St
- 1 Belmont Rd Unit 630
- 1 Belmont Rd Unit 513
- 1 E Belmont Unit 630
- 79 Massachusetts 28
- 6 Bayberry Ln
- 45 Route 28
- 11 Ocean Park W
- 221 Upper County Rd Unit 2A
- 221 Upper County Rd Unit 2A
- 141 Division St
- 141 Division St
- 24 Chase St
- 47 Telegraph Rd Unit 1