Estimated Value: $284,164 - $426,000
--
Bed
--
Bath
1,602
Sq Ft
$237/Sq Ft
Est. Value
About This Home
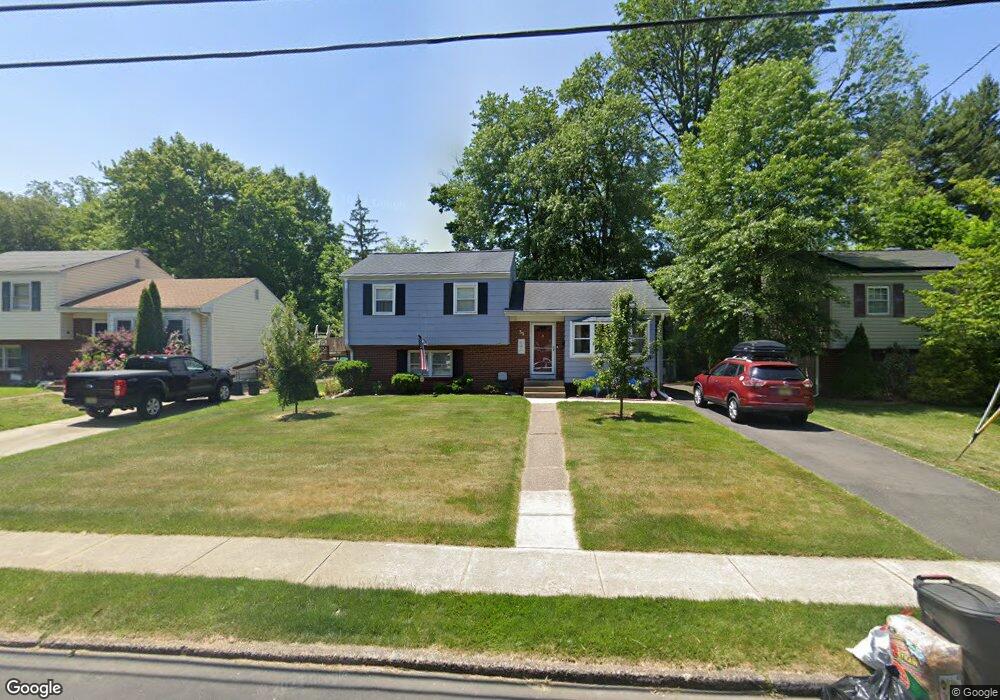
This home is located at 35 Dixmont Ave, Ewing, NJ 08618 and is currently estimated at $379,791, approximately $237 per square foot. 35 Dixmont Ave is a home located in Mercer County with nearby schools including Ewing High School, Trenton Stem-To-Civics Charter School, and Villa Victoria Academy.
Ownership History
Date
Name
Owned For
Owner Type
Purchase Details
Closed on
Jun 2, 1998
Sold by
Woltemate David
Bought by
Schmierer Stephen and Schmierer Linda
Current Estimated Value
Home Financials for this Owner
Home Financials are based on the most recent Mortgage that was taken out on this home.
Original Mortgage
$118,000
Outstanding Balance
$23,545
Interest Rate
7.02%
Mortgage Type
FHA
Estimated Equity
$356,246
Purchase Details
Closed on
Jul 29, 1992
Sold by
Woltemate David S and Woltemate John D
Bought by
Woltemate David S
Purchase Details
Closed on
Aug 10, 1990
Sold by
Woltemate David S and Woltemate John D
Bought by
Woltemate David S and Woltemate John D
Purchase Details
Closed on
Mar 28, 1990
Sold by
Miles George F and Miles Nora K
Bought by
Woltemate David S and Woltemate John D
Create a Home Valuation Report for This Property
The Home Valuation Report is an in-depth analysis detailing your home's value as well as a comparison with similar homes in the area
Home Values in the Area
Average Home Value in this Area
Purchase History
| Date | Buyer | Sale Price | Title Company |
|---|---|---|---|
| Schmierer Stephen | $120,000 | -- | |
| Woltemate David S | -- | -- | |
| Woltemate David S | -- | -- | |
| Woltemate David S | $108,000 | -- |
Source: Public Records
Mortgage History
| Date | Status | Borrower | Loan Amount |
|---|---|---|---|
| Open | Schmierer Stephen | $118,000 |
Source: Public Records
Tax History Compared to Growth
Tax History
| Year | Tax Paid | Tax Assessment Tax Assessment Total Assessment is a certain percentage of the fair market value that is determined by local assessors to be the total taxable value of land and additions on the property. | Land | Improvement |
|---|---|---|---|---|
| 2025 | $7,339 | $186,600 | $62,000 | $124,600 |
| 2024 | $6,899 | $186,600 | $62,000 | $124,600 |
| 2023 | $6,899 | $186,600 | $62,000 | $124,600 |
| 2022 | $6,712 | $186,600 | $62,000 | $124,600 |
| 2021 | $6,548 | $186,600 | $62,000 | $124,600 |
| 2020 | $6,454 | $186,600 | $62,000 | $124,600 |
| 2019 | $6,287 | $186,600 | $62,000 | $124,600 |
| 2018 | $5,979 | $113,200 | $46,000 | $67,200 |
| 2017 | $6,118 | $113,200 | $46,000 | $67,200 |
| 2016 | $6,036 | $113,200 | $46,000 | $67,200 |
| 2015 | $5,955 | $113,200 | $46,000 | $67,200 |
| 2014 | $5,940 | $113,200 | $46,000 | $67,200 |
Source: Public Records
Map
Nearby Homes