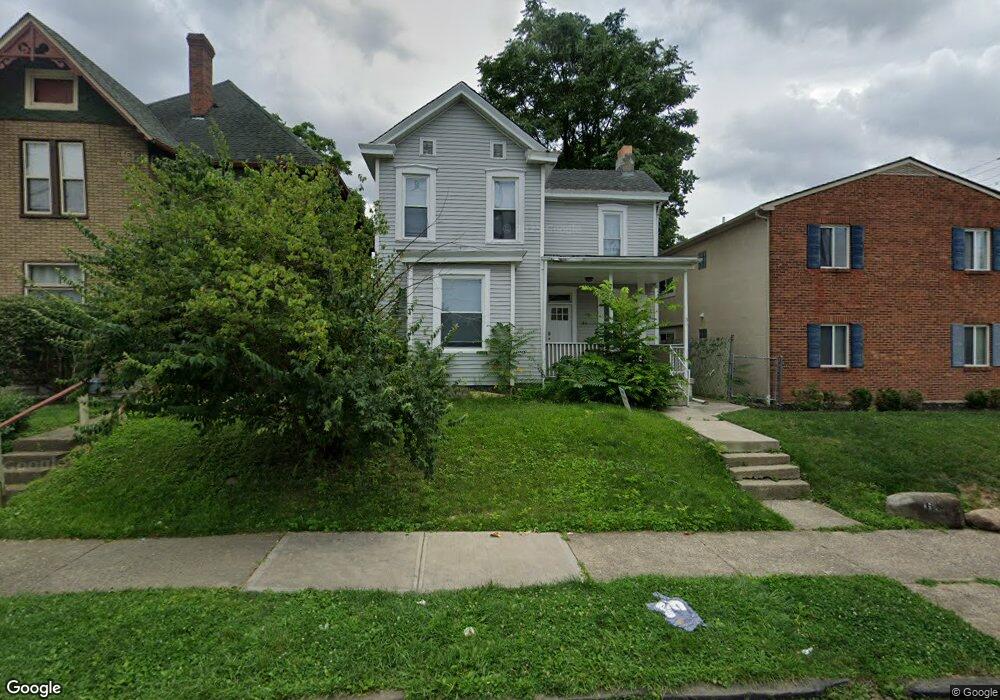
35 E Duncan St Columbus, OH 43202
Old North Columbus NeighborhoodEstimated Value: $279,000 - $497,000
3
Beds
3
Baths
1,844
Sq Ft
$212/Sq Ft
Est. Value
About This Home
This home is located at 35 E Duncan St, Columbus, OH 43202 and is currently estimated at $390,468, approximately $211 per square foot. 35 E Duncan St is a home located in Franklin County with nearby schools including Clinton Elementary School, Dominion Middle School, and Whetstone High School.
Ownership History
Date
Name
Owned For
Owner Type
Purchase Details
Closed on
Feb 10, 2011
Sold by
Patton Gloria D and Patton John C
Bought by
Patton Gloria D and Patton John C
Current Estimated Value
Purchase Details
Closed on
Feb 17, 2010
Sold by
Fifth Third Bank
Bought by
Wagner Jerrod
Home Financials for this Owner
Home Financials are based on the most recent Mortgage that was taken out on this home.
Original Mortgage
$107,550
Outstanding Balance
$70,013
Interest Rate
5.02%
Mortgage Type
Construction
Estimated Equity
$320,455
Purchase Details
Closed on
Aug 9, 2004
Sold by
Bidwell David M and Beachler Jinx Statler
Bought by
Fifth Third Bank
Purchase Details
Closed on
Mar 13, 1996
Sold by
Niswonger Steven
Bought by
David M Bidwell
Home Financials for this Owner
Home Financials are based on the most recent Mortgage that was taken out on this home.
Original Mortgage
$68,300
Interest Rate
7.06%
Mortgage Type
New Conventional
Purchase Details
Closed on
Jul 30, 1993
Purchase Details
Closed on
Jan 19, 1993
Create a Home Valuation Report for This Property
The Home Valuation Report is an in-depth analysis detailing your home's value as well as a comparison with similar homes in the area
Home Values in the Area
Average Home Value in this Area
Purchase History
| Date | Buyer | Sale Price | Title Company |
|---|---|---|---|
| Patton Gloria D | -- | Talon Group | |
| Wagner Jerrod | $97,500 | Talon Group | |
| Fifth Third Bank | -- | Attorney | |
| David M Bidwell | $71,900 | -- | |
| -- | -- | -- | |
| -- | -- | -- |
Source: Public Records
Mortgage History
| Date | Status | Borrower | Loan Amount |
|---|---|---|---|
| Open | Wagner Jerrod | $107,550 | |
| Previous Owner | David M Bidwell | $68,300 |
Source: Public Records
Tax History
| Year | Tax Paid | Tax Assessment Tax Assessment Total Assessment is a certain percentage of the fair market value that is determined by local assessors to be the total taxable value of land and additions on the property. | Land | Improvement |
|---|---|---|---|---|
| 2025 | $5,307 | $118,240 | $41,270 | $76,970 |
| 2024 | $5,307 | $118,240 | $41,270 | $76,970 |
| 2023 | $5,239 | $118,230 | $41,265 | $76,965 |
| 2022 | $3,778 | $72,840 | $23,310 | $49,530 |
| 2021 | $3,785 | $72,840 | $23,310 | $49,530 |
| 2020 | $3,789 | $72,840 | $23,310 | $49,530 |
| 2019 | $3,274 | $53,970 | $17,920 | $36,050 |
| 2018 | $3,198 | $53,970 | $17,920 | $36,050 |
| 2017 | $3,359 | $53,970 | $17,920 | $36,050 |
| 2016 | $3,446 | $52,020 | $11,100 | $40,920 |
| 2015 | $3,128 | $52,020 | $11,100 | $40,920 |
| 2014 | $3,136 | $52,020 | $11,100 | $40,920 |
| 2013 | $1,473 | $49,525 | $10,570 | $38,955 |
Source: Public Records
Map
Nearby Homes
- 74 E Dodridge St
- 2540 Neil Ave
- 109 E Arcadia Ave
- 2683 Neil Ave Unit 685
- 6 E Blake Ave
- 53 Olentangy St
- 23 E Maynard Ave
- 2394 Neil Ave
- 2717 Hibbert Ave
- 210 E Blake Ave
- 2478-2480 Deming Ave
- 2458- 2458 1 2 Deming Ave
- 68 E Oakland Ave
- 2470 Indianola Ave
- 29 Crestview Rd
- 2343 Indianola Ave
- 366 Parkview Dr Unit 366
- 415 Glen Echo Cir
- 2771 Indianola Ave
- 2362 Indiana Ave
- 39 E Duncan St Unit 41
- 27 E Duncan St
- 41 E Duncan St
- 45 1/2 E Duncan St Unit 45.5
- 2585 East Ave Unit 587
- 2585-2587 East Ave
- 2590 East Ave Unit 2590
- 19 E Duncan St
- 2644 N Pearl St
- 2579 East Ave Unit 581
- 2579-2581 East Ave
- 2581 East Ave
- 57 E Duncan St
- 24 E Duncan St
- 44 E Duncan St
- 19 & 21 E Duncan St
- 61 E Duncan St Unit 63
- 14 E Hudson St
- 2590 N High St
- 2588 East Ave
Your Personal Tour Guide
Ask me questions while you tour the home.