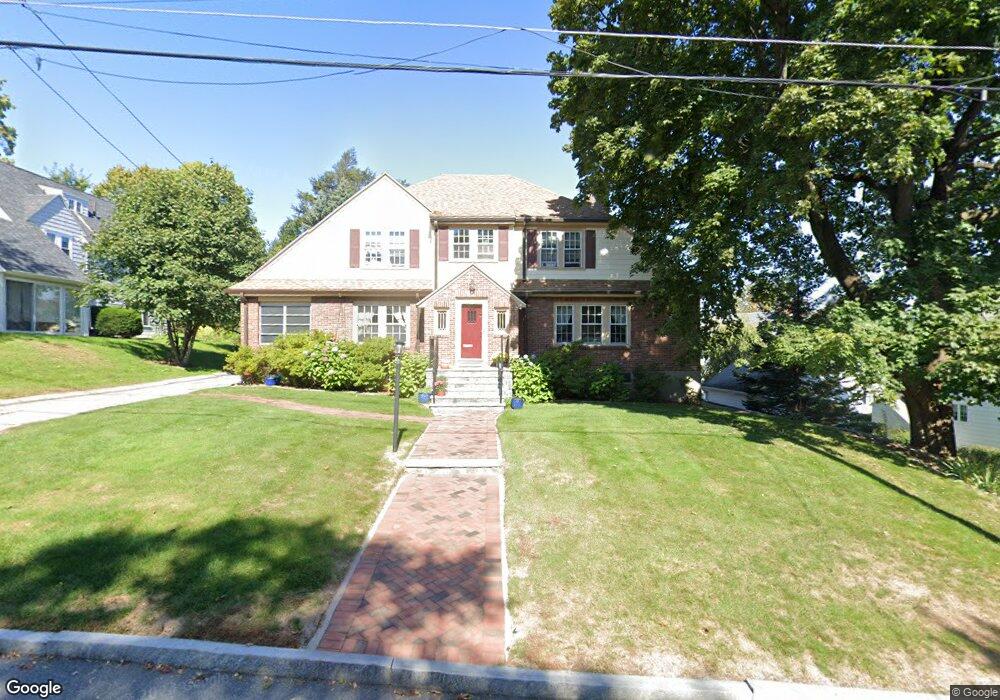
35 Elm St Belmont, MA 02478
Cushing Square NeighborhoodEstimated Value: $1,791,000 - $2,082,000
4
Beds
3
Baths
2,313
Sq Ft
$841/Sq Ft
Est. Value
About This Home
This home is located at 35 Elm St, Belmont, MA 02478 and is currently estimated at $1,945,632, approximately $841 per square foot. 35 Elm St is a home located in Middlesex County with nearby schools including Mary Lee Burbank Elementary School, Winthrop L Chenery Middle School, and Belmont High School.
Ownership History
Date
Name
Owned For
Owner Type
Purchase Details
Closed on
Oct 12, 2001
Sold by
Sateriale Emil Est
Bought by
Fogel Robert
Current Estimated Value
Home Financials for this Owner
Home Financials are based on the most recent Mortgage that was taken out on this home.
Original Mortgage
$576,000
Outstanding Balance
$226,126
Interest Rate
6.93%
Mortgage Type
Purchase Money Mortgage
Estimated Equity
$1,719,506
Create a Home Valuation Report for This Property
The Home Valuation Report is an in-depth analysis detailing your home's value as well as a comparison with similar homes in the area
Home Values in the Area
Average Home Value in this Area
Purchase History
| Date | Buyer | Sale Price | Title Company |
|---|---|---|---|
| Fogel Robert | $720,000 | -- |
Source: Public Records
Mortgage History
| Date | Status | Borrower | Loan Amount |
|---|---|---|---|
| Open | Fogel Robert | $576,000 |
Source: Public Records
Tax History Compared to Growth
Tax History
| Year | Tax Paid | Tax Assessment Tax Assessment Total Assessment is a certain percentage of the fair market value that is determined by local assessors to be the total taxable value of land and additions on the property. | Land | Improvement |
|---|---|---|---|---|
| 2025 | $19,944 | $1,751,000 | $815,000 | $936,000 |
| 2024 | $18,047 | $1,709,000 | $966,000 | $743,000 |
| 2023 | $17,815 | $1,585,000 | $911,000 | $674,000 |
| 2022 | $16,901 | $1,462,000 | $833,000 | $629,000 |
| 2021 | $10,849 | $1,564,000 | $1,042,000 | $522,000 |
| 2020 | $4,726 | $1,414,000 | $892,000 | $522,000 |
| 2019 | $14,004 | $1,200,000 | $675,000 | $525,000 |
| 2018 | $13,438 | $1,106,000 | $613,000 | $493,000 |
| 2017 | $13,096 | $1,032,000 | $539,000 | $493,000 |
| 2016 | $12,912 | $1,028,000 | $539,000 | $489,000 |
| 2015 | $12,281 | $952,000 | $464,000 | $488,000 |
Source: Public Records
Map
Nearby Homes
- 73 Foster Rd Unit 2
- 276 Belmont St Unit 1
- 147 Langdon Ave Unit 149
- 36 Madison St
- 133 Hillside Rd
- 30 Unity Ave Unit 30
- 456 Belmont St Unit 10
- 456 Belmont St Unit 21
- 10 Marlboro St Unit 1
- 105 Watson Rd
- 56-58 Edgecliff Rd
- 125 Trapelo Rd Unit 21
- 125 Trapelo Rd Unit 23
- 81 Winsor Ave
- 87 Templeton Pkwy Unit 3
- 163 Belmont St
- 16 Ericsson St
- 263 Common St
- 118 Blanchard Rd
- 161 Cushing St
- 31 Elm St
- 136 Lewis Rd
- 144 Lewis Rd
- 4 Elizabeth Rd
- 22 Elm St
- 12 Elizabeth Rd
- 29 Elm St
- 0 Elizabeth Island Unit 70489913
- 1234 Lewis Rd
- 113 Stults Rd
- 25 Elm St
- 21 Elm St
- 14 Elm St
- 118 Lewis Rd Unit 120
- 118 Lewis Rd
- 118 Lewis Rd Unit 1
- 120 Lewis Rd Unit 120
- 118 Lewis Rd Unit 118
- 118 Lewis Rd Unit 2
- 120 Lewis Rd Unit 1