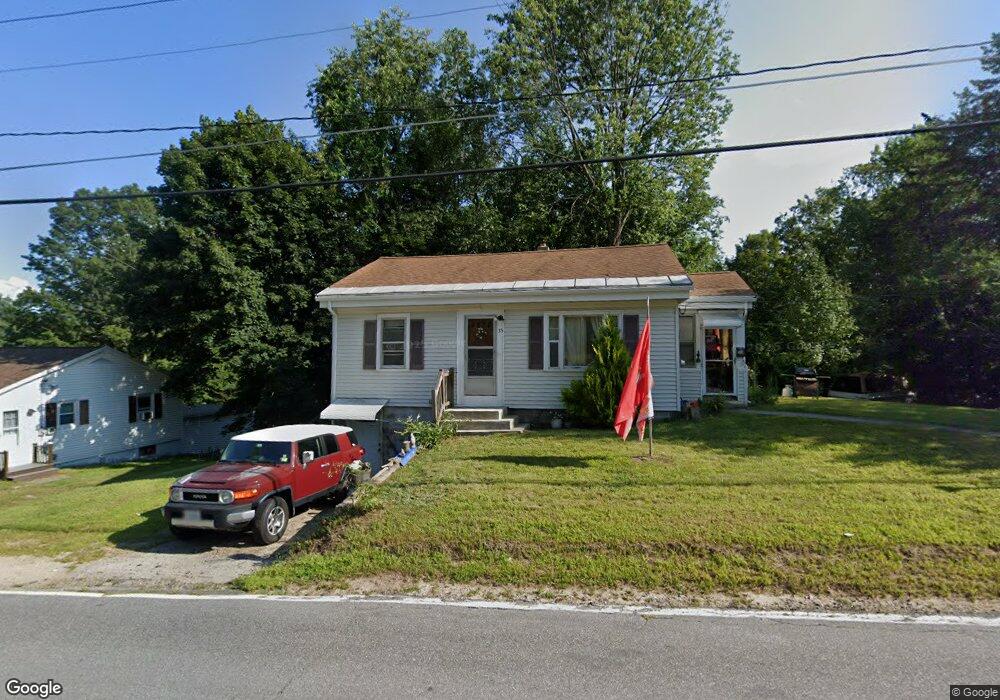
35 Elm St Farmington, NH 03835
Estimated Value: $276,000 - $313,000
2
Beds
1
Bath
910
Sq Ft
$324/Sq Ft
Est. Value
About This Home
This home is located at 35 Elm St, Farmington, NH 03835 and is currently estimated at $294,692, approximately $323 per square foot. 35 Elm St is a home located in Strafford County with nearby schools including Valley View Community School, Henry Wilson Memorial School, and Farmington Senior High School.
Ownership History
Date
Name
Owned For
Owner Type
Purchase Details
Closed on
Mar 5, 2021
Sold by
Bush Ronald L
Bought by
Bush Ronald L and Bush Susy K
Current Estimated Value
Purchase Details
Closed on
Feb 5, 2007
Sold by
Hagan Michael S and Hagan Diane
Bought by
Bush Ronald L
Home Financials for this Owner
Home Financials are based on the most recent Mortgage that was taken out on this home.
Original Mortgage
$110,400
Interest Rate
6.16%
Mortgage Type
Purchase Money Mortgage
Purchase Details
Closed on
Aug 19, 2004
Sold by
Smith Lillian M Est
Bought by
Hagan Michael S and Hagan Diane
Home Financials for this Owner
Home Financials are based on the most recent Mortgage that was taken out on this home.
Original Mortgage
$115,430
Interest Rate
6.03%
Mortgage Type
Purchase Money Mortgage
Create a Home Valuation Report for This Property
The Home Valuation Report is an in-depth analysis detailing your home's value as well as a comparison with similar homes in the area
Home Values in the Area
Average Home Value in this Area
Purchase History
| Date | Buyer | Sale Price | Title Company |
|---|---|---|---|
| Bush Ronald L | -- | None Available | |
| Bush Ronald L | $147,300 | -- | |
| Hagan Michael S | $119,000 | -- |
Source: Public Records
Mortgage History
| Date | Status | Borrower | Loan Amount |
|---|---|---|---|
| Previous Owner | Hagan Michael S | $111,222 | |
| Previous Owner | Hagan Michael S | $110,400 | |
| Previous Owner | Hagan Michael S | $115,430 |
Source: Public Records
Tax History Compared to Growth
Tax History
| Year | Tax Paid | Tax Assessment Tax Assessment Total Assessment is a certain percentage of the fair market value that is determined by local assessors to be the total taxable value of land and additions on the property. | Land | Improvement |
|---|---|---|---|---|
| 2024 | $3,521 | $236,600 | $117,000 | $119,600 |
| 2023 | $3,097 | $120,700 | $46,800 | $73,900 |
| 2022 | $2,919 | $120,700 | $46,800 | $73,900 |
| 2021 | $2,821 | $120,700 | $46,800 | $73,900 |
| 2020 | $2,766 | $120,700 | $46,800 | $73,900 |
| 2019 | $2,684 | $120,700 | $46,800 | $73,900 |
| 2018 | $2,545 | $96,900 | $36,600 | $60,300 |
| 2017 | $2,695 | $96,900 | $36,600 | $60,300 |
| 2016 | $2,425 | $96,900 | $36,600 | $60,300 |
| 2015 | $2,431 | $96,900 | $36,600 | $60,300 |
| 2014 | $2,360 | $96,900 | $36,600 | $60,300 |
| 2013 | $2,380 | $113,330 | $50,100 | $63,230 |
Source: Public Records
Map
Nearby Homes