
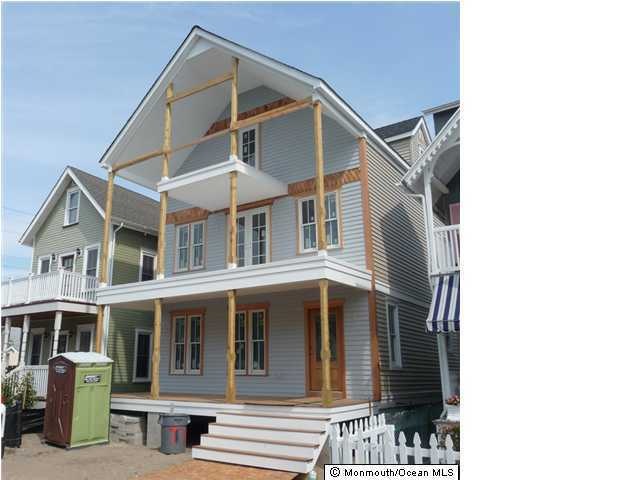
35 Embury Ave Ocean Grove, NJ 07756
3
Beds
2.5
Baths
2,950
Sq Ft
2,004
Sq Ft Lot
Highlights
- Water Views
- Victorian Architecture
- No HOA
- Wood Flooring
- 1 Fireplace
- 2-minute walk to Ocean Grove Park
About This Home
As of July 2013Two blocks to beach and town. House is currently under construction. Tentative completion date is October first.
Last Agent to Sell the Property
C21/ Coastal Realtors License #8130855 Listed on: 05/23/2012
Home Details
Home Type
- Single Family
Est. Annual Taxes
- $8,793
Year Built
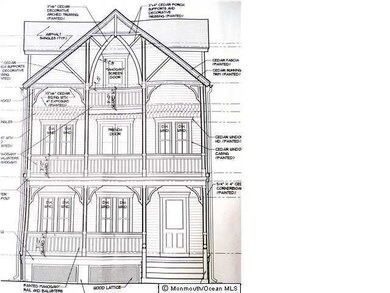
- Built in 1889
Home Design
- Victorian Architecture
- Shingle Roof
- Clap Board Siding
- Clapboard
Interior Spaces
- 2-Story Property
- 1 Fireplace
- Water Views
- Basement Fills Entire Space Under The House
Flooring
- Wood
- Tile
Bedrooms and Bathrooms
- 3 Bedrooms
Outdoor Features
- Porch
Utilities
- Zoned Heating
- Heating System Uses Natural Gas
- Natural Gas Water Heater
Community Details
- No Home Owners Association
- Ocean Grove Subdivision
Listing and Financial Details
- Assessor Parcel Number 3500019000000604
Similar Homes in the area
Create a Home Valuation Report for This Property
The Home Valuation Report is an in-depth analysis detailing your home's value as well as a comparison with similar homes in the area
Home Values in the Area
Average Home Value in this Area
Mortgage History
| Date | Status | Loan Amount | Loan Type |
|---|---|---|---|
| Closed | $430,000 | New Conventional | |
| Closed | $495,000 | New Conventional | |
| Closed | $407,943 | Unknown |
Source: Public Records
Property History
| Date | Event | Price | Change | Sq Ft Price |
|---|---|---|---|---|
| 07/03/2013 07/03/13 | Sold | $695,000 | -- | $236 / Sq Ft |
Source: MOREMLS (Monmouth Ocean Regional REALTORS®)
Tax History Compared to Growth
Tax History
| Year | Tax Paid | Tax Assessment Tax Assessment Total Assessment is a certain percentage of the fair market value that is determined by local assessors to be the total taxable value of land and additions on the property. | Land | Improvement |
|---|---|---|---|---|
| 2024 | $20,156 | $1,396,000 | $612,300 | $783,700 |
| 2023 | $20,156 | $1,136,200 | $655,000 | $481,200 |
| 2022 | $17,725 | $899,500 | $441,400 | $458,100 |
| 2021 | $15,554 | $853,400 | $497,300 | $356,100 |
| 2020 | $17,454 | $837,100 | $497,300 | $339,800 |
| 2019 | $15,554 | $736,100 | $417,300 | $318,800 |
| 2018 | $15,799 | $740,000 | $417,300 | $322,700 |
| 2017 | $14,442 | $648,800 | $340,300 | $308,500 |
| 2016 | $15,499 | $695,000 | $399,800 | $295,200 |
| 2015 | $15,221 | $695,000 | $399,800 | $295,200 |
| 2014 | $14,575 | $546,900 | $274,800 | $272,100 |
Source: Public Records
Agents Affiliated with this Home
-
G
Seller's Agent in 2013
Gary Huizenga
C21/ Coastal Realtors
(732) 774-7166
27 in this area
40 Total Sales
Map
Source: MOREMLS (Monmouth Ocean Regional REALTORS®)
MLS Number: 21219343
APN: 35-00213-0000-00021
Disclaimer: Certain information contained herein is derived from information provided by parties other than Homes.com. All information provided is deemed reliable, but is not guaranteed to be accurate and should be independently verified.
![]() IDX information is provided exclusively for personal, non-commercial use, and may not be used for any purpose other than to identify prospective properties consumers may be interested in purchasing.
IDX information is provided exclusively for personal, non-commercial use, and may not be used for any purpose other than to identify prospective properties consumers may be interested in purchasing.
Information is deemed reliable but not guaranteed.
Nearby Homes
- 28 Olin St
- 54 Olin St
- 52 Pitman Ave Unit 3K
- 30 Central Ave
- 6 Arlington Ct Unit 6
- 20 Mcclintock St
- 68 Mount Tabor Way Unit 2
- 68 Mount Tabor Way
- 9 Pitman Ave
- 89 Heck Ave
- 85 Mount Hermon Way
- 73 Clark Ave
- 70 Clark Ave
- 82 Mount Zion Way
- 104 Heck Ave
- 117 Kent Ave
- 109 Webb Ave
- 110 Main Ave
- 11 Pilgrim Pathway
- 78 Lake Ave