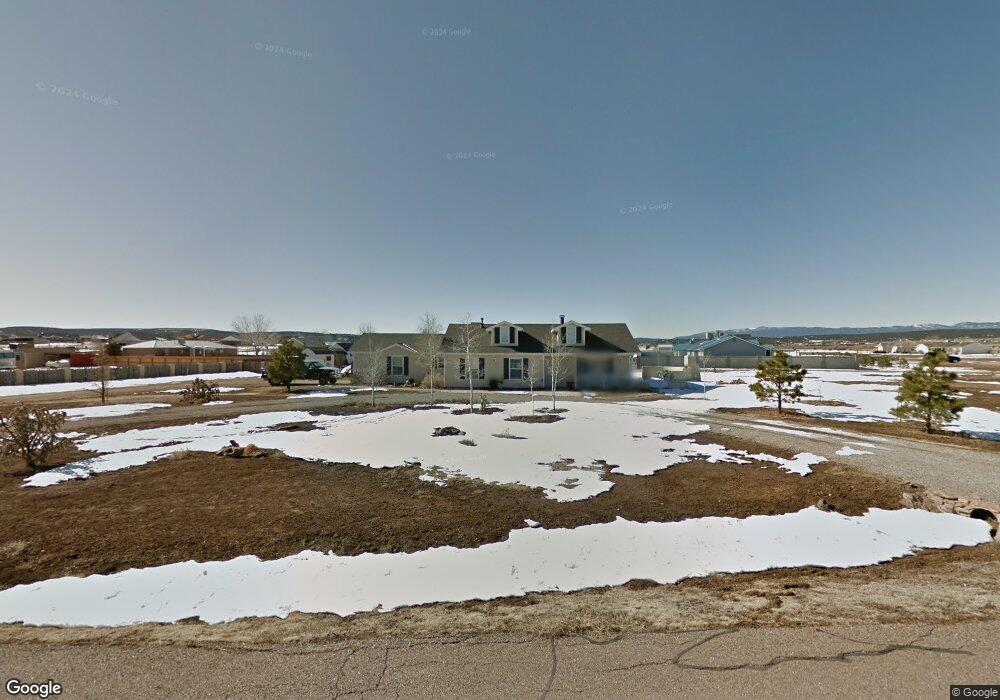
35 Epoch Rd Edgewood, NM 87015
Estimated Value: $310,000 - $368,000
3
Beds
2
Baths
1,528
Sq Ft
$227/Sq Ft
Est. Value
About This Home
This home is located at 35 Epoch Rd, Edgewood, NM 87015 and is currently estimated at $346,578, approximately $226 per square foot. 35 Epoch Rd is a home located in Santa Fe County with nearby schools including South Mountain Elementary School, Edgewood Middle School, and Moriarty High School.
Ownership History
Date
Name
Owned For
Owner Type
Purchase Details
Closed on
Jul 18, 2000
Sold by
Express Development Llc
Bought by
Elite Homes Ltd Company
Current Estimated Value
Home Financials for this Owner
Home Financials are based on the most recent Mortgage that was taken out on this home.
Original Mortgage
$107,250
Outstanding Balance
$44,580
Interest Rate
11%
Mortgage Type
Construction
Estimated Equity
$301,998
Create a Home Valuation Report for This Property
The Home Valuation Report is an in-depth analysis detailing your home's value as well as a comparison with similar homes in the area
Home Values in the Area
Average Home Value in this Area
Purchase History
| Date | Buyer | Sale Price | Title Company |
|---|---|---|---|
| Elite Homes Ltd Company | -- | First American Title |
Source: Public Records
Mortgage History
| Date | Status | Borrower | Loan Amount |
|---|---|---|---|
| Open | Elite Homes Ltd Company | $107,250 |
Source: Public Records
Tax History
| Year | Tax Paid | Tax Assessment Tax Assessment Total Assessment is a certain percentage of the fair market value that is determined by local assessors to be the total taxable value of land and additions on the property. | Land | Improvement |
|---|---|---|---|---|
| 2025 | $1,226 | $158,985 | $20,140 | $138,845 |
| 2024 | $1,244 | $154,355 | $19,554 | $134,801 |
| 2023 | $1,218 | $149,860 | $18,985 | $130,875 |
| 2022 | $1,191 | $145,497 | $18,433 | $127,064 |
| 2021 | $1,161 | $47,087 | $5,965 | $41,122 |
| 2020 | $1,135 | $45,716 | $5,791 | $39,925 |
| 2019 | $1,116 | $44,384 | $5,623 | $38,761 |
| 2018 | $1,083 | $43,092 | $5,459 | $37,633 |
| 2017 | $1,033 | $41,837 | $5,300 | $36,537 |
| 2016 | $914 | $40,618 | $5,146 | $35,472 |
| 2015 | $912 | $39,436 | $4,997 | $34,439 |
| 2014 | $900 | $38,249 | $4,992 | $33,258 |
Source: Public Records
Map
Nearby Homes
- 24 Futures Loop
- 17 Corte Agave
- 0 Dinkle Hillcrest Unit 1084100
- 0 Dinkle Hillcrest Unit 12-D
- 3 Quail Run E
- 10 Mustang Rd
- 93 Rainbow Rd
- 15 Mountain View Ln
- 6 Serrania Dr
- 6 Thunder Chief
- 10 Duchess Ct
- 10 Circle Rd S
- 9 Halfmoon Rd
- 109 Church St E
- 9 Express Dr
- 39 Maple Rd
- 87 N Frontage Rd
- 41 Madole Rd
- 180 Horton Rd
- 245 Horton Rd
Your Personal Tour Guide
Ask me questions while you tour the home.