35 Fielding St Worcester, MA 01603
Webster Square NeighborhoodEstimated Value: $349,000 - $492,000
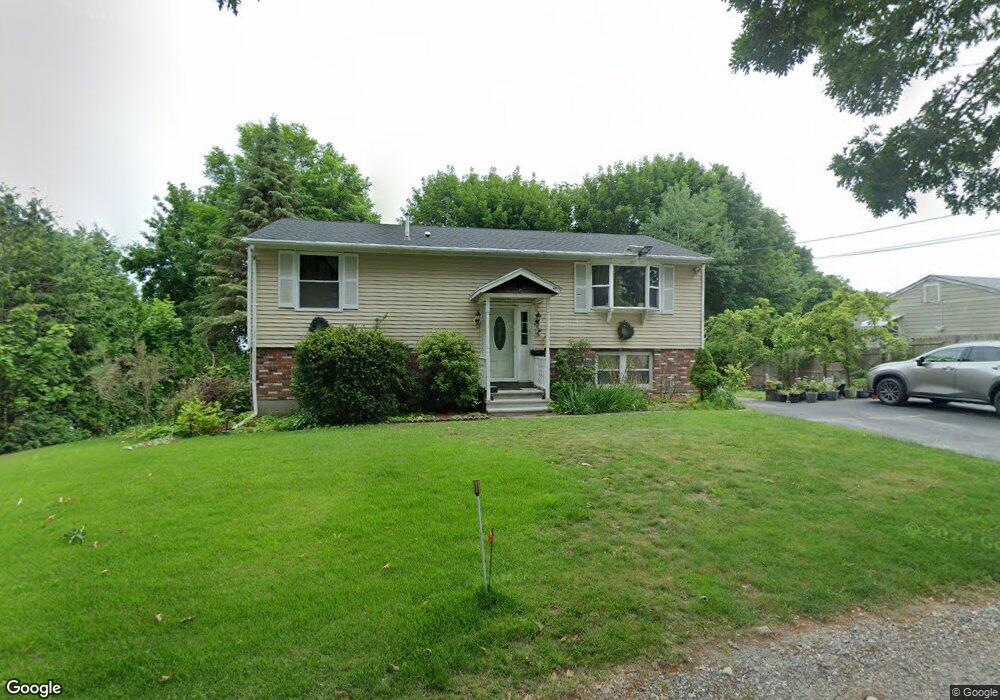
About This Home
This home is located at 35 Fielding St, Worcester, MA 01603 and is currently estimated at $424,472, approximately $442 per square foot. 35 Fielding St is a home located in Worcester County with nearby schools including Jacob Hiatt Magnet School, Chandler Magnet, and Heard Street Discovery Academy.
Ownership History
We collect this data history from publicly available records. To have your information removed, we recommend requesting removal directly through your county’s website.
Purchase Details
Home Financials for this Owner
Home Financials are based on the most recent Mortgage that was taken out on this home.Purchase Details
Home Values in the Area
Average Home Value in this Area
Purchase History
We collect this data history from publicly available records. To have your information removed, we recommend requesting removal directly through your county’s website.
| Date | Buyer | Sale Price | Title Company |
|---|---|---|---|
| $110,000 | -- | ||
| $100,000 | -- |
Mortgage History
We collect this data history from publicly available records. To have your information removed, we recommend requesting removal directly through your county’s website.
| Date | Status | Borrower | Loan Amount |
|---|---|---|---|
| Open | $88,000 |
Tax History
We collect this data history from publicly available records. To have your information removed, we recommend requesting removal directly through your county’s website.
| Year | Tax Paid | Tax Assessment Tax Assessment Total Assessment is a certain percentage of the fair market value that is determined by local assessors to be the total taxable value of land and additions on the property. | Land | Improvement |
|---|---|---|---|---|
| 2025 | $4,814 | $365,000 | $98,700 | $266,300 |
| 2024 | $4,769 | $346,800 | $98,700 | $248,100 |
| 2023 | $4,655 | $324,600 | $85,800 | $238,800 |
| 2022 | $4,035 | $265,300 | $68,700 | $196,600 |
| 2021 | $3,953 | $242,800 | $55,000 | $187,800 |
| 2020 | $3,760 | $221,200 | $54,500 | $166,700 |
| 2019 | $3,645 | $202,500 | $47,700 | $154,800 |
| 2018 | $3,659 | $193,500 | $47,700 | $145,800 |
| 2017 | $3,500 | $182,100 | $47,700 | $134,400 |
| 2016 | $3,458 | $167,800 | $34,500 | $133,300 |
| 2015 | $3,368 | $167,800 | $34,500 | $133,300 |
| 2014 | $3,279 | $167,800 | $34,500 | $133,300 |
Map
- 1 Clegg St
- 1560 Main St
- 1511 Main St Unit CPH9
- 1511 Main St Unit C405
- 92-94 Sargent St
- 18 Healy Rd
- 25 Ludlow St
- 30 Parsons Hill Dr
- 18 Sherer Trail
- 17 Tallawanda Dr
- 6 Pond Ct
- 11 Hulbert Rd Unit 15
- 46 Chapel St
- 1 Eames Ave
- 29 Passway 5
- 11 Wayne St
- 23 Lakewood St
- 13 Marilyn Dr
- 23 Cowden St
- 8 Horseshoe Dr
- 23 Fielding St
- 37 Fielding St
- 21 Fielding St
- 21 Fielding St Unit 1
- 1512 Main St
- 32 Fielding St - Right Side
- 1514 Main St
- 1520 Main St
- 30 Fielding St
- 1504 Main St
- 32 Fielding St
- 10 Clegg St
- 4 Clegg St
- 6 Clegg St Unit 3
- 6 Clegg St
- 6 Clegg St Unit 2
- 6 Clegg St Unit 1
- 34 Fielding St
- 2 Clegg St
- 17 Fielding St
Ask me questions while you tour the home.