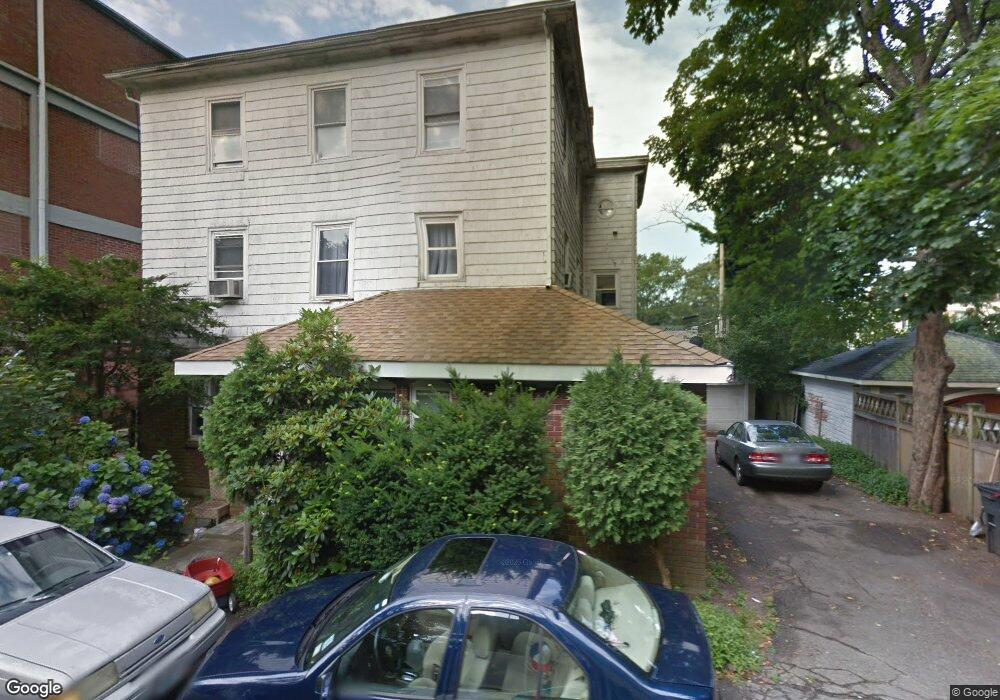
35 Fir St Newport, RI 02840
Old Beach NeighborhoodEstimated Value: $1,916,000 - $2,333,000
8
Beds
3
Baths
4,103
Sq Ft
$535/Sq Ft
Est. Value
About This Home
This home is located at 35 Fir St, Newport, RI 02840 and is currently estimated at $2,194,000, approximately $534 per square foot. 35 Fir St is a home located in Newport County with nearby schools including Rogers High School, St Michael's Country Day School, and St George's School.
Ownership History
Date
Name
Owned For
Owner Type
Purchase Details
Closed on
Dec 21, 2020
Sold by
Nehra Mandeep K and Nehra Monica
Bought by
Nehra Rentals Llc
Current Estimated Value
Purchase Details
Closed on
Dec 3, 2019
Sold by
Nehra Rentals Llc
Bought by
Nehra Mandeep K and Nehra Monica
Purchase Details
Closed on
Jan 17, 2018
Sold by
Nehra Mandeep K and Nehra Monica
Bought by
Nehra Rentals Llc
Purchase Details
Closed on
Jul 20, 2016
Sold by
Silva Elizabeth C and Dolfinger Kristian J
Bought by
Nehra Mandeep K and Nehra Monica
Purchase Details
Closed on
Oct 11, 2002
Sold by
Difante Gino M
Bought by
Sears Brian M
Home Financials for this Owner
Home Financials are based on the most recent Mortgage that was taken out on this home.
Original Mortgage
$342,000
Interest Rate
6.24%
Mortgage Type
Purchase Money Mortgage
Purchase Details
Closed on
Nov 20, 1995
Sold by
Freeman Gregory J and Freeman Audrey L
Bought by
Difante Gino M
Create a Home Valuation Report for This Property
The Home Valuation Report is an in-depth analysis detailing your home's value as well as a comparison with similar homes in the area
Home Values in the Area
Average Home Value in this Area
Purchase History
| Date | Buyer | Sale Price | Title Company |
|---|---|---|---|
| Nehra Rentals Llc | -- | None Available | |
| Nehra Mandeep K | -- | None Available | |
| Nehra Rentals Llc | -- | -- | |
| Nehra Mandeep K | $448,000 | -- | |
| Sears Brian M | $380,000 | -- | |
| Difante Gino M | $125,000 | -- |
Source: Public Records
Mortgage History
| Date | Status | Borrower | Loan Amount |
|---|---|---|---|
| Previous Owner | Difante Gino M | $342,000 | |
| Previous Owner | Difante Gino M | $140,000 |
Source: Public Records
Tax History Compared to Growth
Tax History
| Year | Tax Paid | Tax Assessment Tax Assessment Total Assessment is a certain percentage of the fair market value that is determined by local assessors to be the total taxable value of land and additions on the property. | Land | Improvement |
|---|---|---|---|---|
| 2025 | $12,117 | $1,394,500 | $571,300 | $823,200 |
| 2024 | $11,463 | $1,394,500 | $571,300 | $823,200 |
| 2023 | $8,536 | $860,500 | $325,600 | $534,900 |
| 2022 | $8,269 | $860,500 | $325,600 | $534,900 |
| 2021 | $4,955 | $531,100 | $325,600 | $205,500 |
| 2020 | $5,188 | $504,700 | $284,400 | $220,300 |
| 2019 | $5,188 | $504,700 | $284,400 | $220,300 |
| 2018 | $5,042 | $504,700 | $284,400 | $220,300 |
| 2017 | $5,312 | $473,900 | $218,700 | $255,200 |
| 2016 | $5,180 | $473,900 | $218,700 | $255,200 |
| 2015 | $5,057 | $473,900 | $218,700 | $255,200 |
| 2014 | $4,516 | $374,500 | $171,000 | $203,500 |
Source: Public Records
Map
Nearby Homes
- 8 Cottage St Unit 2
- 24 Old Beach Rd
- 4 Red Cross Ave Unit 4
- 33 Kay St
- 5 Pell St
- 1 Pell St
- 34 Bull St
- 50 School St Unit 7
- 12 Mount Vernon St Unit 5
- 75 Pelham St Unit B
- 42 Mann Ave
- 60 Prospect Hill St
- 130 Spring St Unit 132
- 10 Barney St Unit 102
- 10 Barney St Unit 107
- 10 Barney St Unit 101
- 10 Barney St Unit U106
- 23 Mann Ave Unit 4
- 26 Franklin St
- 55 Hunter Ave
- 5 Fir St
- 3 Fir St
- 3 Fir St Unit 3
- 3 Fir St Unit 2
- 20 Fir St
- 6 Cottage St
- 8 Cottage St Unit 5
- 8 Cottage St Unit 6
- 8 Cottage St Unit 3
- 8 Cottage St Unit 4
- 19 Catherine St
- 10 Cottage St
- 0 Cottage St
- 24 Old Beach Rd Unit 3
- 22 Old Beach Rd
- 26 Old Beach Rd
- 34 Catherine St Unit COT
- 34 Catherine St Unit C
- 34 Catherine St Unit B
- 34 Catherine St Unit A