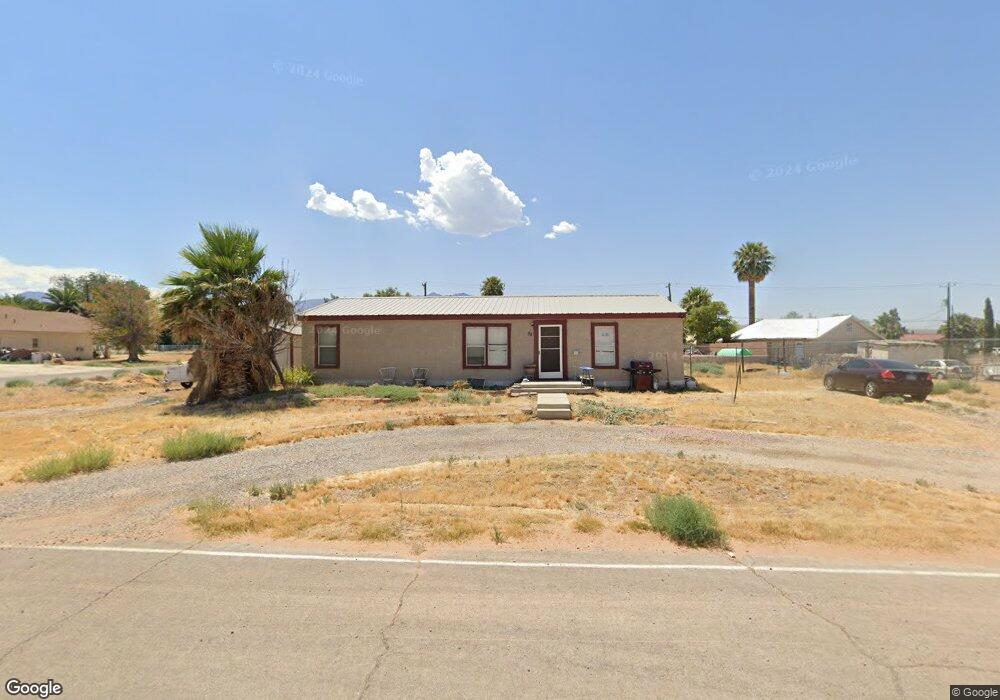
35 First North St Bunkerville, NV 89007
Estimated Value: $199,000 - $202,288
3
Beds
2
Baths
1,344
Sq Ft
$149/Sq Ft
Est. Value
About This Home
This home is located at 35 First North St, Bunkerville, NV 89007 and is currently estimated at $200,644, approximately $149 per square foot. 35 First North St is a home with nearby schools including Joseph L. Bowler Sr. Elementary School, Charles Arthur Hughes Middle School, and Virgin Valley High School.
Ownership History
Date
Name
Owned For
Owner Type
Purchase Details
Closed on
Oct 20, 2005
Sold by
Dalton Lonnie K
Bought by
Abbott Laren C and Abbott Chelsie S
Current Estimated Value
Home Financials for this Owner
Home Financials are based on the most recent Mortgage that was taken out on this home.
Original Mortgage
$135,375
Outstanding Balance
$70,264
Interest Rate
5.67%
Mortgage Type
FHA
Estimated Equity
$130,380
Purchase Details
Closed on
Mar 16, 2005
Sold by
Dalton Lonnie K
Bought by
Dalton Lonnie K
Purchase Details
Closed on
Jan 7, 2005
Sold by
Martinsen Jerry B and Martinsen Mindy L
Bought by
Dalton Lonnie K
Home Financials for this Owner
Home Financials are based on the most recent Mortgage that was taken out on this home.
Original Mortgage
$96,500
Interest Rate
5.8%
Mortgage Type
Construction
Create a Home Valuation Report for This Property
The Home Valuation Report is an in-depth analysis detailing your home's value as well as a comparison with similar homes in the area
Purchase History
| Date | Buyer | Sale Price | Title Company |
|---|---|---|---|
| Abbott Laren C | $137,500 | Mesquite Title Company | |
| Dalton Lonnie K | -- | Lawyers Title Of Nevada | |
| Dalton Lonnie K | $25,000 | Lawyers Title Of Nevada |
Source: Public Records
Mortgage History
| Date | Status | Borrower | Loan Amount |
|---|---|---|---|
| Open | Abbott Laren C | $135,375 | |
| Previous Owner | Dalton Lonnie K | $96,500 |
Source: Public Records
Tax History
| Year | Tax Paid | Tax Assessment Tax Assessment Total Assessment is a certain percentage of the fair market value that is determined by local assessors to be the total taxable value of land and additions on the property. | Land | Improvement |
|---|---|---|---|---|
| 2026 | $1,228 | $49,587 | $16,100 | $33,487 |
| 2025 | $1,177 | $48,699 | $14,700 | $33,999 |
| 2024 | $1,091 | $48,699 | $14,700 | $33,999 |
| 2023 | $1,091 | $45,076 | $13,440 | $31,636 |
| 2022 | $1,010 | $39,994 | $11,200 | $28,794 |
| 2021 | $957 | $37,875 | $10,570 | $27,305 |
| 2020 | $898 | $36,829 | $9,800 | $27,029 |
| 2019 | $842 | $36,491 | $9,800 | $26,691 |
| 2018 | $803 | $35,503 | $9,800 | $25,703 |
| 2017 | $908 | $35,988 | $9,800 | $26,188 |
| 2016 | $751 | $29,738 | $7,000 | $22,738 |
| 2015 | $750 | $29,976 | $7,000 | $22,976 |
| 2014 | $756 | $32,206 | $7,000 | $25,206 |
Source: Public Records
Map
Nearby Homes
- 1389 Harbour Dr
- 840 W Pioneer
- 463 Hagens Aly
- 364 Sam Way
- 317 Sam Way
- 307 Sam Way
- 287 Sam Way
- 375 Habib Way
- Unit 1 Plan at Vista Del Luna
- 775 Moss Dr Unit 7
- Beckett Plan at The Fields
- Weston Plan at The Fields
- Graham Plan at The Fields
- 257 Vineyard Ln
- 254 Reber Dr
- 271 Concord Dr
- 777 2nd St S
- 479 Apogee Crest St
- 468 Apogee Crest St
- 121 Hermosa Way
- 30 W Virgin St
- 52 W Virgin St
- 30 E Virgin St
- 74 W Virgin St
- 25 Main St
- 60 E Virgin St
- 70 E Virgin St
- 35 E Virgin St
- 65 W Virgin St
- 47 Main St
- 80 E Virgin St
- 100 First St N
- 55 E Virgin St
- 85 W Virgin St
- 100 E Virgin St
- 22 W 1st South St
- 87 E Virgin St
- 33 S 1st West St
- 75 E Virgin St
- 30 E 1st South St
Your Personal Tour Guide
Ask me questions while you tour the home.