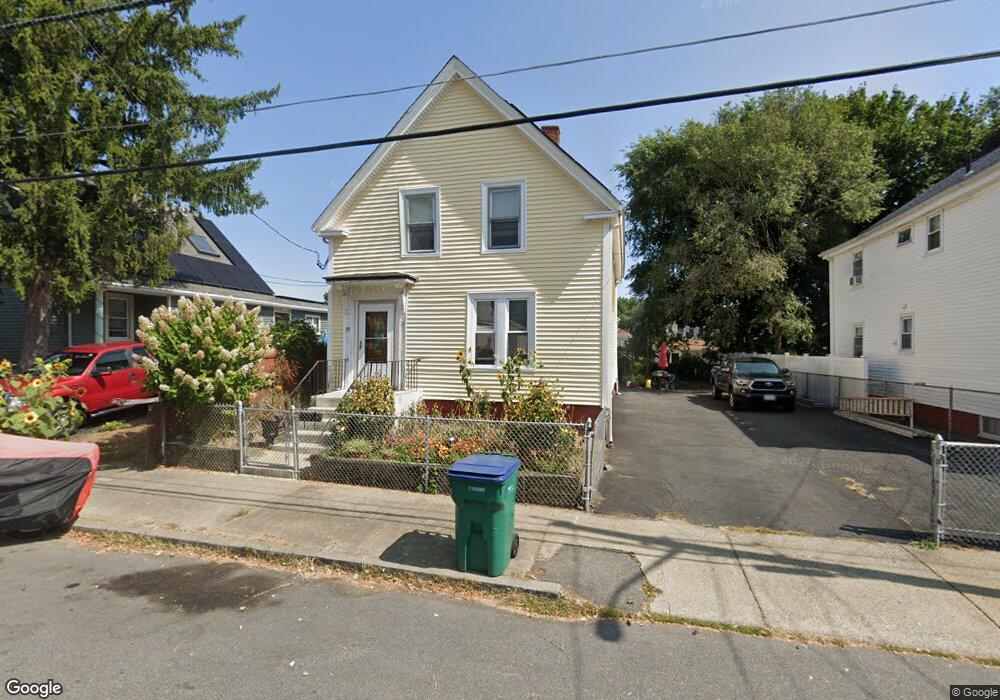
35 Flint St Lynn, MA 01905
Lower Boston Street NeighborhoodEstimated Value: $566,000 - $622,000
2
Beds
3
Baths
1,476
Sq Ft
$398/Sq Ft
Est. Value
About This Home
This home is located at 35 Flint St, Lynn, MA 01905 and is currently estimated at $586,725, approximately $397 per square foot. 35 Flint St is a home located in Essex County with nearby schools including William R. Fallon School, Lincoln-Thomson Elementary School, and Breed Middle School.
Ownership History
Date
Name
Owned For
Owner Type
Purchase Details
Closed on
Sep 30, 2008
Sold by
Us Bk
Bought by
Ly Meng Huong
Current Estimated Value
Home Financials for this Owner
Home Financials are based on the most recent Mortgage that was taken out on this home.
Original Mortgage
$82,000
Outstanding Balance
$54,449
Interest Rate
6.57%
Mortgage Type
Purchase Money Mortgage
Estimated Equity
$532,276
Purchase Details
Closed on
Apr 8, 2008
Sold by
Thomas-Nosa Vivian
Bought by
Us Bk
Purchase Details
Closed on
May 24, 2006
Sold by
Nosa Greg
Bought by
Nosa Greg
Purchase Details
Closed on
Oct 16, 2001
Sold by
Nationscredit Fincl Sv
Bought by
Nosa Greg
Purchase Details
Closed on
Apr 15, 1994
Sold by
Spyropoulos Stella
Bought by
Syharath Keo and Sinlapakone Southong
Create a Home Valuation Report for This Property
The Home Valuation Report is an in-depth analysis detailing your home's value as well as a comparison with similar homes in the area
Home Values in the Area
Average Home Value in this Area
Purchase History
| Date | Buyer | Sale Price | Title Company |
|---|---|---|---|
| Ly Meng Huong | $102,500 | -- | |
| Ly Meng Huong | $102,500 | -- | |
| Us Bk | $167,920 | -- | |
| Us Bk | $167,920 | -- | |
| Nosa Greg | -- | -- | |
| Nosa Greg | -- | -- | |
| Nosa Greg | $160,000 | -- | |
| Nosa Greg | $160,000 | -- | |
| Syharath Keo | $70,000 | -- | |
| Syharath Keo | $70,000 | -- |
Source: Public Records
Mortgage History
| Date | Status | Borrower | Loan Amount |
|---|---|---|---|
| Open | Syharath Keo | $82,000 | |
| Closed | Syharath Keo | $82,000 |
Source: Public Records
Tax History
| Year | Tax Paid | Tax Assessment Tax Assessment Total Assessment is a certain percentage of the fair market value that is determined by local assessors to be the total taxable value of land and additions on the property. | Land | Improvement |
|---|---|---|---|---|
| 2025 | $5,423 | $523,500 | $226,000 | $297,500 |
| 2024 | $5,048 | $479,400 | $198,500 | $280,900 |
| 2023 | $5,025 | $450,700 | $205,000 | $245,700 |
| 2022 | $4,610 | $370,900 | $151,800 | $219,100 |
| 2021 | $4,481 | $343,900 | $139,600 | $204,300 |
| 2020 | $4,293 | $320,400 | $134,400 | $186,000 |
| 2019 | $4,310 | $301,400 | $126,500 | $174,900 |
| 2018 | $4,324 | $285,400 | $139,600 | $145,800 |
| 2017 | $3,900 | $250,000 | $116,000 | $134,000 |
| 2016 | $3,801 | $234,900 | $108,600 | $126,300 |
| 2015 | $3,643 | $217,500 | $107,800 | $109,700 |
Source: Public Records
Map
Nearby Homes
- 28 Wyman St
- 73 Waterhill St
- 50-50A Kirtland St
- 447 Boston St
- 93 Robinson St
- 37 Sargents Ct
- 70 Farrell Rd
- 268 Walnut St
- 45 Cottage St Unit 3
- 79 Laurel St
- 40 Grove St
- 11 Margin St Unit 6
- 274 Boston St
- 16 River St Unit 6
- 32 Birch Brook Rd Unit 13
- 32 Birch Brook Rd Unit 27
- 32 Birch Brook Rd Unit 26
- 32 Birch Brook Rd Unit 16
- 32 Birch Brook Rd Unit 1
- 32 Birch Brook Rd Unit 15