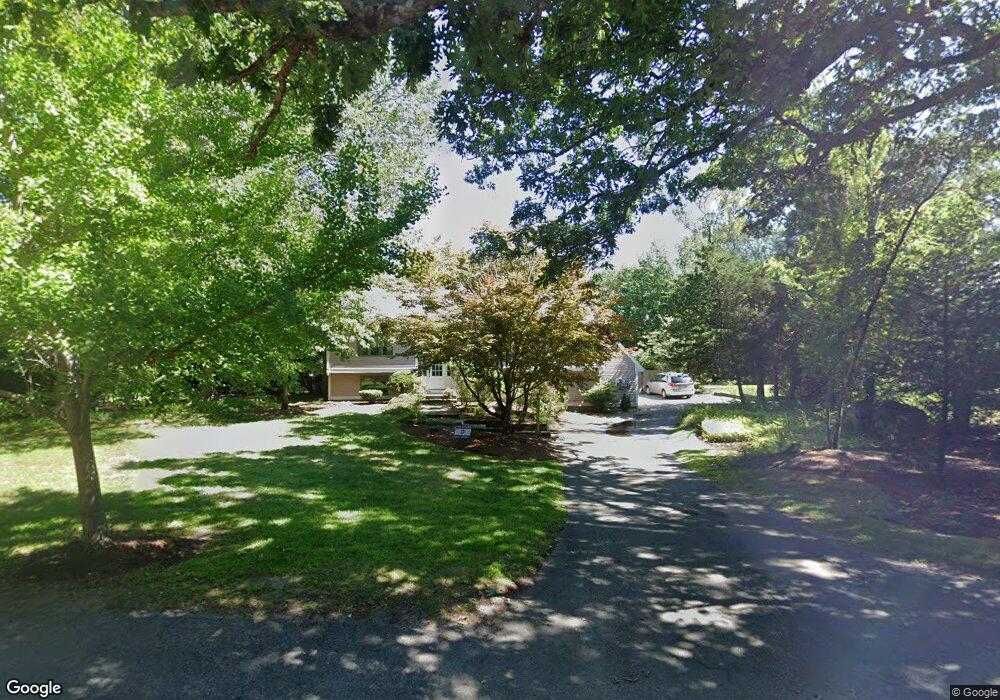
35 French St Hingham, MA 02043
Estimated Value: $1,094,000 - $1,255,000
3
Beds
3
Baths
2,277
Sq Ft
$521/Sq Ft
Est. Value
About This Home
This home is located at 35 French St, Hingham, MA 02043 and is currently estimated at $1,186,083, approximately $520 per square foot. 35 French St is a home located in Plymouth County with nearby schools including Plymouth River Elementary School, South Shore Conservatory of Music Preschool, and St. Paul Elementary School.
Ownership History
Date
Name
Owned For
Owner Type
Purchase Details
Closed on
Jul 22, 1999
Sold by
Tanguy Brian A and Tanguy Joanne L
Bought by
Bergstein Steven H and Bergstein Sally A
Current Estimated Value
Purchase Details
Closed on
Jun 25, 1998
Sold by
Zstgalov Stephen J and Zsigalov Gay S
Bought by
Williams Frederick and Williams Barbara L
Create a Home Valuation Report for This Property
The Home Valuation Report is an in-depth analysis detailing your home's value as well as a comparison with similar homes in the area
Home Values in the Area
Average Home Value in this Area
Purchase History
| Date | Buyer | Sale Price | Title Company |
|---|---|---|---|
| Bergstein Steven H | $365,000 | -- | |
| Williams Frederick | $207,500 | -- |
Source: Public Records
Mortgage History
| Date | Status | Borrower | Loan Amount |
|---|---|---|---|
| Open | Williams Frederick | $100,000 |
Source: Public Records
Tax History Compared to Growth
Tax History
| Year | Tax Paid | Tax Assessment Tax Assessment Total Assessment is a certain percentage of the fair market value that is determined by local assessors to be the total taxable value of land and additions on the property. | Land | Improvement |
|---|---|---|---|---|
| 2025 | $8,973 | $839,400 | $456,200 | $383,200 |
| 2024 | $8,709 | $802,700 | $456,200 | $346,500 |
| 2023 | $7,678 | $767,800 | $456,200 | $311,600 |
| 2022 | $7,461 | $645,400 | $352,200 | $293,200 |
| 2021 | $6,050 | $616,100 | $352,200 | $263,900 |
| 2020 | $7,118 | $611,600 | $352,200 | $259,400 |
| 2019 | $4,914 | $575,400 | $352,200 | $223,200 |
| 2018 | $3,123 | $570,900 | $352,200 | $218,700 |
| 2017 | $4,488 | $594,900 | $360,200 | $234,700 |
| 2016 | $7,495 | $600,100 | $343,100 | $257,000 |
| 2015 | $7,315 | $583,800 | $326,800 | $257,000 |
Source: Public Records
Map
Nearby Homes