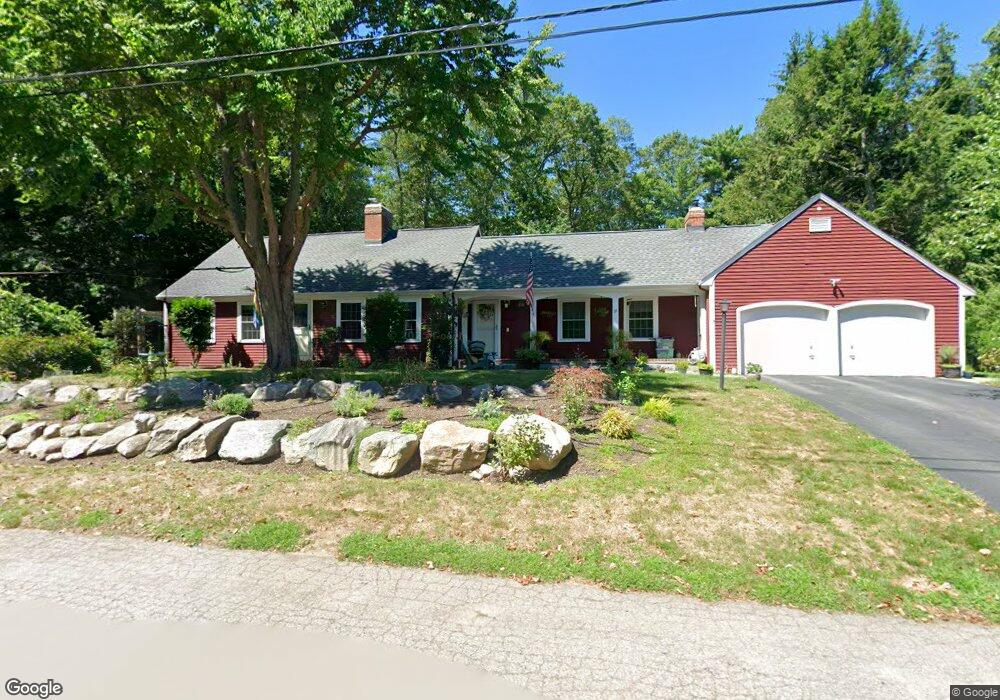
35 Hatch Rd Attleboro, MA 02703
Estimated Value: $666,000 - $741,000
4
Beds
2
Baths
2,112
Sq Ft
$326/Sq Ft
Est. Value
About This Home
This home is located at 35 Hatch Rd, Attleboro, MA 02703 and is currently estimated at $689,050, approximately $326 per square foot. 35 Hatch Rd is a home located in Bristol County with nearby schools including A. Irvin Studley Elementary School, Cyril K. Brennan Middle School, and Attleboro High School.
Ownership History
Date
Name
Owned For
Owner Type
Purchase Details
Closed on
Sep 29, 2009
Sold by
Hagar Int
Bought by
Melanson Christopher E and Obrien Nancy A
Current Estimated Value
Home Financials for this Owner
Home Financials are based on the most recent Mortgage that was taken out on this home.
Original Mortgage
$257,000
Outstanding Balance
$167,048
Interest Rate
5.31%
Mortgage Type
Purchase Money Mortgage
Estimated Equity
$522,002
Purchase Details
Closed on
Jun 20, 2003
Sold by
Hagar Kathleen S
Bought by
Hagar Int
Purchase Details
Closed on
Jul 7, 1988
Sold by
Smith Pierce B
Bought by
Hagar Roger E
Create a Home Valuation Report for This Property
The Home Valuation Report is an in-depth analysis detailing your home's value as well as a comparison with similar homes in the area
Home Values in the Area
Average Home Value in this Area
Purchase History
| Date | Buyer | Sale Price | Title Company |
|---|---|---|---|
| Melanson Christopher E | $307,000 | -- | |
| Hagar Int | -- | -- | |
| Hagar Roger E | $235,000 | -- |
Source: Public Records
Mortgage History
| Date | Status | Borrower | Loan Amount |
|---|---|---|---|
| Open | Melanson Christopher E | $257,000 | |
| Previous Owner | Hagar Roger E | $25,000 | |
| Previous Owner | Hagar Roger E | $70,000 | |
| Previous Owner | Hagar Roger E | $25,000 |
Source: Public Records
Tax History
| Year | Tax Paid | Tax Assessment Tax Assessment Total Assessment is a certain percentage of the fair market value that is determined by local assessors to be the total taxable value of land and additions on the property. | Land | Improvement |
|---|---|---|---|---|
| 2025 | $8,062 | $642,400 | $176,700 | $465,700 |
| 2024 | $7,536 | $592,000 | $159,300 | $432,700 |
| 2023 | $7,227 | $527,900 | $160,900 | $367,000 |
| 2022 | $6,029 | $417,200 | $153,500 | $263,700 |
| 2021 | $4,734 | $393,200 | $147,700 | $245,500 |
| 2020 | $5,528 | $379,700 | $141,100 | $238,600 |
| 2019 | $4,730 | $364,400 | $138,500 | $225,900 |
| 2018 | $4,823 | $330,900 | $134,500 | $196,400 |
| 2017 | $4,595 | $323,100 | $131,100 | $192,000 |
| 2016 | $4,482 | $302,400 | $122,700 | $179,700 |
| 2015 | $4,236 | $288,000 | $122,700 | $165,300 |
| 2014 | $4,146 | $279,200 | $117,300 | $161,900 |
Source: Public Records
Map
Nearby Homes
- 160 West St
- 52 Deanville Rd
- 46 Berwick Rd
- 15 North Ave
- 26 West St
- 75 Dennis St Unit 3
- 64 Mechanic St Unit 3
- 64 Mechanic St
- 10 John St
- 71 Elmwood Ave
- 49 Dennis St
- 18-20 Jefferson St
- 660 Thacher St Unit 402
- 101 South Ave Unit 301
- 101 South Ave Unit 1004
- 101 South Ave Unit 803
- 147 County St
- 17 Jewel Ave
- 0 Rosedale Ln Unit 73469293
- 17 Crawford Ave
Your Personal Tour Guide
Ask me questions while you tour the home.