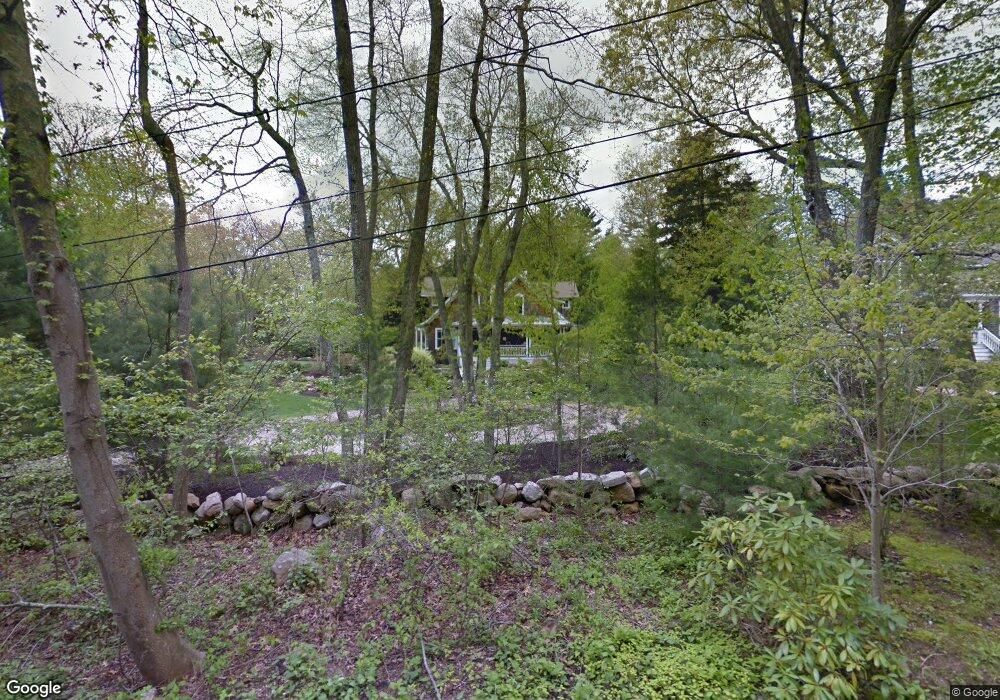
35 Hayden Rd Westerly, RI 02891
Estimated Value: $1,192,000 - $1,533,843
3
Beds
4
Baths
2,537
Sq Ft
$544/Sq Ft
Est. Value
About This Home
This home is located at 35 Hayden Rd, Westerly, RI 02891 and is currently estimated at $1,379,961, approximately $543 per square foot. 35 Hayden Rd is a home located in Washington County with nearby schools including Westerly High School.
Ownership History
Date
Name
Owned For
Owner Type
Purchase Details
Closed on
Oct 30, 2024
Sold by
Mugford Kristin W and Mugford Stephen
Bought by
Jody M Mugford T
Current Estimated Value
Home Financials for this Owner
Home Financials are based on the most recent Mortgage that was taken out on this home.
Original Mortgage
$700,000
Outstanding Balance
$692,272
Interest Rate
6.09%
Mortgage Type
Purchase Money Mortgage
Estimated Equity
$687,690
Purchase Details
Closed on
Jun 14, 2002
Sold by
Natalie E Decapite Tr and Decapite
Bought by
Mugford Stephen A and Mugford Kristen W
Home Financials for this Owner
Home Financials are based on the most recent Mortgage that was taken out on this home.
Original Mortgage
$300,700
Interest Rate
6.8%
Mortgage Type
Purchase Money Mortgage
Create a Home Valuation Report for This Property
The Home Valuation Report is an in-depth analysis detailing your home's value as well as a comparison with similar homes in the area
Home Values in the Area
Average Home Value in this Area
Purchase History
| Date | Buyer | Sale Price | Title Company |
|---|---|---|---|
| Jody M Mugford T | $1,150,000 | None Available | |
| Jody M Mugford T | $1,150,000 | None Available | |
| Mugford Stephen A | $385,000 | -- | |
| Mugford Stephen A | $385,000 | -- |
Source: Public Records
Mortgage History
| Date | Status | Borrower | Loan Amount |
|---|---|---|---|
| Open | Jody M Mugford T | $700,000 | |
| Closed | Jody M Mugford T | $700,000 | |
| Previous Owner | Mugford Stephen A | $300,000 | |
| Previous Owner | Mugford Stephen A | $300,700 | |
| Previous Owner | Mugford Stephen A | $87,000 |
Source: Public Records
Tax History
| Year | Tax Paid | Tax Assessment Tax Assessment Total Assessment is a certain percentage of the fair market value that is determined by local assessors to be the total taxable value of land and additions on the property. | Land | Improvement |
|---|---|---|---|---|
| 2025 | $10,681 | $1,502,300 | $813,100 | $689,200 |
| 2024 | $10,956 | $1,116,800 | $580,800 | $536,000 |
| 2023 | $10,744 | $1,116,800 | $580,800 | $536,000 |
| 2022 | $10,677 | $1,116,800 | $580,800 | $536,000 |
| 2021 | $9,739 | $845,400 | $416,400 | $429,000 |
| 2020 | $9,561 | $845,400 | $416,400 | $429,000 |
| 2019 | $9,468 | $845,400 | $416,400 | $429,000 |
| 2018 | $8,960 | $754,200 | $378,600 | $375,600 |
| 2017 | $8,741 | $754,200 | $378,600 | $375,600 |
| 2016 | $8,809 | $754,200 | $378,600 | $375,600 |
| 2015 | $8,369 | $773,500 | $386,500 | $387,000 |
| 2014 | $8,230 | $773,500 | $386,500 | $387,000 |
Source: Public Records
Map
Nearby Homes
- 346 Post Rd
- 342 Post Rd
- 5259 Old Post Rd
- 35 Robin Hollow Ln
- 5 Robin Hollow Ln
- 853 W Beach Rd
- 135 Ross Hill Rd
- 143 Ross Hill Rd
- 43 Noyes Neck Rd
- 5717 Post Rd
- 34 Buddington Rd
- 22 Breach Dr
- 30 Clifford Dr
- 26 Charlene Ave
- 20 Snowberry Ln
- 13 Plateau Rd
- 118 Dunns Corner Rd
- 5 Fletcher Dr
- 470 Atlantic Ave
- 446 Atlantic Ave
Your Personal Tour Guide
Ask me questions while you tour the home.