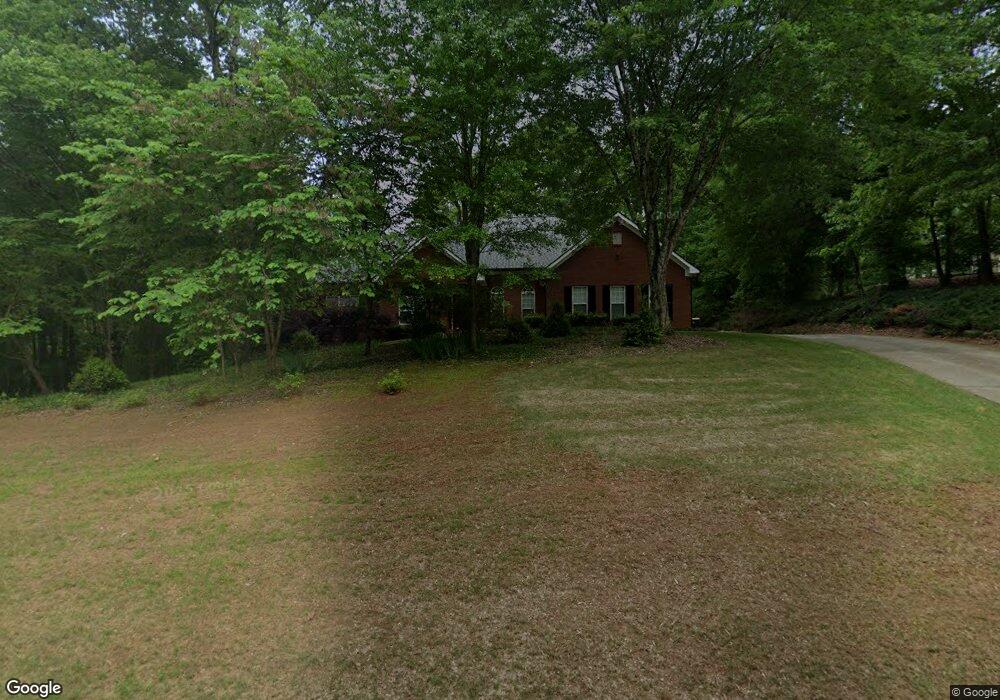
35 High St Unit E-2 Sharpsburg, GA 30277
Estimated Value: $561,000 - $758,000
4
Beds
4
Baths
4,929
Sq Ft
$131/Sq Ft
Est. Value
About This Home
This home is located at 35 High St Unit E-2, Sharpsburg, GA 30277 and is currently estimated at $645,664, approximately $130 per square foot. 35 High St Unit E-2 is a home located in Coweta County with nearby schools including Canongate Elementary School, Madras Middle School, and Northgate High School.
Ownership History
Date
Name
Owned For
Owner Type
Purchase Details
Closed on
Jan 9, 2012
Sold by
Sexton John D
Bought by
Sexton Nancy Mary and Sexton Nancy Mary Living Trust
Current Estimated Value
Purchase Details
Closed on
Oct 9, 2011
Sold by
Sexton Nancy Mary
Bought by
Sexton John D and Sexton Nancy M
Purchase Details
Closed on
Mar 15, 1999
Sold by
Piedmont Homes Inc
Bought by
Sexton John D and Sexton Nancy M
Home Financials for this Owner
Home Financials are based on the most recent Mortgage that was taken out on this home.
Original Mortgage
$200,000
Interest Rate
6.74%
Mortgage Type
New Conventional
Purchase Details
Closed on
Nov 3, 1995
Bought by
Piedmont Homes Inc
Purchase Details
Closed on
Apr 30, 1977
Bought by
Patten Seed Company
Create a Home Valuation Report for This Property
The Home Valuation Report is an in-depth analysis detailing your home's value as well as a comparison with similar homes in the area
Home Values in the Area
Average Home Value in this Area
Purchase History
| Date | Buyer | Sale Price | Title Company |
|---|---|---|---|
| Sexton Nancy Mary | -- | -- | |
| Sexton John D | -- | -- | |
| Sexton Nancy Mary | -- | -- | |
| Sexton John D | $252,900 | -- | |
| Piedmont Homes Inc | $239,400 | -- | |
| Patten Seed Company | -- | -- |
Source: Public Records
Mortgage History
| Date | Status | Borrower | Loan Amount |
|---|---|---|---|
| Previous Owner | Sexton John D | $200,000 |
Source: Public Records
Tax History Compared to Growth
Tax History
| Year | Tax Paid | Tax Assessment Tax Assessment Total Assessment is a certain percentage of the fair market value that is determined by local assessors to be the total taxable value of land and additions on the property. | Land | Improvement |
|---|---|---|---|---|
| 2025 | $4,400 | $236,376 | $32,000 | $204,376 |
| 2024 | $3,935 | $212,602 | $32,000 | $180,602 |
| 2023 | $3,935 | $229,920 | $28,000 | $201,920 |
| 2022 | $4,975 | $206,669 | $28,000 | $178,669 |
| 2021 | $4,597 | $179,284 | $20,000 | $159,284 |
| 2020 | $4,626 | $179,284 | $20,000 | $159,284 |
| 2019 | $4,306 | $151,924 | $20,000 | $131,924 |
| 2018 | $4,314 | $151,924 | $20,000 | $131,924 |
| 2017 | $4,073 | $143,752 | $20,000 | $123,752 |
| 2016 | $3,959 | $141,417 | $20,000 | $121,417 |
| 2015 | $3,895 | $141,417 | $20,000 | $121,417 |
| 2014 | $2,771 | $102,640 | $10,000 | $92,640 |
Source: Public Records
Map
Nearby Homes
- 35 Palmer Place
- 40 Joe Lee Dr
- 291 Cannongate Rd
- 30 Joe Lee Dr
- 9 Warrior Way
- 518 Palmetto Tyrone Rd
- 78 Rosebay Ln
- 56 Hudgen Rd
- 32 Riverbirch Way
- 0 Fischer Spur Rd Unit 10495301
- 20 Skipton Ct
- 140 Palmetto Pines Rd
- 70 N Strathmore Dr
- 27 Dorian Ct
- 40 Wenham Ln
- 575 Laurelwood Dr
- 10 Monteray Ct
- 500 Laurelwood Dr
- 110 Kylemore Pass
- 50 Big Oaks Ct
- 35 High St
- 25 High St
- 45 High St
- 210 Oconee Woods Trail
- 200 Oconee Woods Trail
- 50 High St
- 0 High St Unit 8809762
- 0 High St Unit E-7 7589709
- 30 High St
- 30 High St Unit E-7
- 125 Lawn Market
- 60 High St
- 119 Lawn Market
- 205 Oconee Woods Trail
- 190 Oconee Woods Trail
- 20 High St
- 225 Lawn Market
- 215 Lawn Market
- 135 Lawn Market
- 195 Oconee Woods Trail