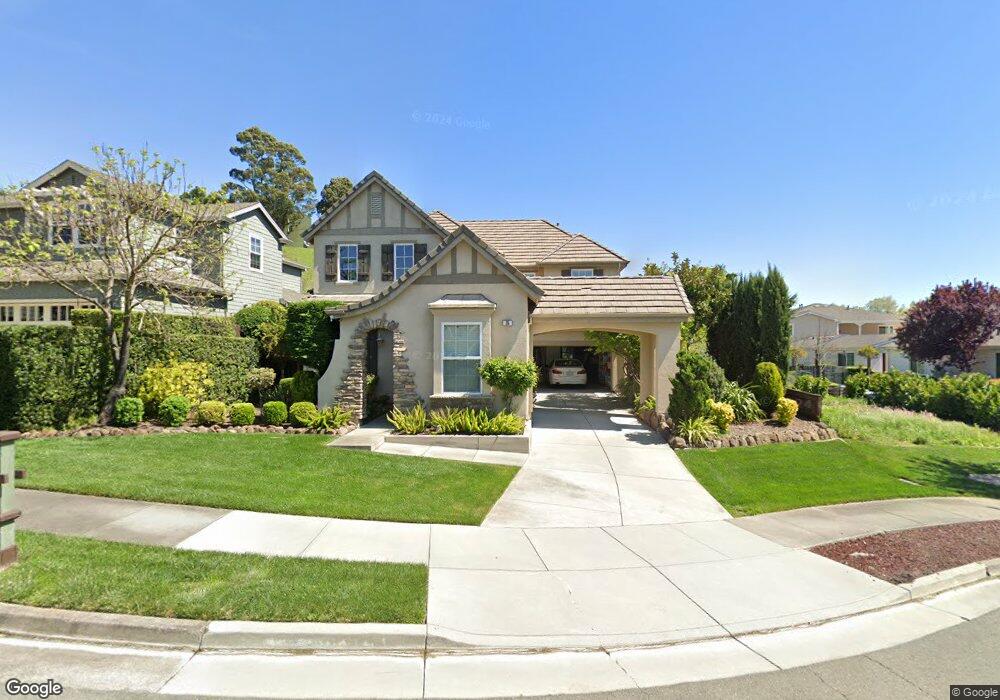
35 Hollyleaf Way Novato, CA 94949
Ignacio NeighborhoodEstimated Value: $1,575,000 - $1,619,000
4
Beds
3
Baths
2,554
Sq Ft
$624/Sq Ft
Est. Value
About This Home
This home is located at 35 Hollyleaf Way, Novato, CA 94949 and is currently estimated at $1,594,092, approximately $624 per square foot. 35 Hollyleaf Way is a home located in Marin County with nearby schools including Loma Verde Elementary School, Novato High School, and Novato Charter School.
Ownership History
Date
Name
Owned For
Owner Type
Purchase Details
Closed on
May 29, 2024
Sold by
Glinski Ivona
Bought by
Ivona Glinski Trust and Glinski
Current Estimated Value
Purchase Details
Closed on
Sep 8, 2014
Sold by
Glinski Bogdan I
Bought by
Glinski Ivona
Home Financials for this Owner
Home Financials are based on the most recent Mortgage that was taken out on this home.
Original Mortgage
$605,000
Interest Rate
3.37%
Mortgage Type
Adjustable Rate Mortgage/ARM
Purchase Details
Closed on
Mar 8, 2004
Sold by
Shea Homes Lp
Bought by
Glinski Bogdan I and Glinski Ivona
Home Financials for this Owner
Home Financials are based on the most recent Mortgage that was taken out on this home.
Original Mortgage
$624,130
Interest Rate
4.5%
Mortgage Type
Purchase Money Mortgage
Purchase Details
Closed on
Nov 7, 2003
Sold by
Novato Community Partners Llc
Bought by
Shea Homes Lp
Purchase Details
Closed on
Mar 25, 2003
Sold by
Novato Community Partners Llc
Bought by
Shea Homes Lp
Create a Home Valuation Report for This Property
The Home Valuation Report is an in-depth analysis detailing your home's value as well as a comparison with similar homes in the area
Home Values in the Area
Average Home Value in this Area
Purchase History
| Date | Buyer | Sale Price | Title Company |
|---|---|---|---|
| Ivona Glinski Trust | -- | None Listed On Document | |
| Glinski Ivona | -- | Old Republic Title Company | |
| Glinski Bogdan I | $780,500 | California Land Title Marin | |
| Shea Homes Lp | -- | California Land Title Marin | |
| Shea Homes Lp | -- | Cal Land Title |
Source: Public Records
Mortgage History
| Date | Status | Borrower | Loan Amount |
|---|---|---|---|
| Previous Owner | Glinski Ivona | $605,000 | |
| Previous Owner | Glinski Bogdan I | $624,130 |
Source: Public Records
Tax History Compared to Growth
Tax History
| Year | Tax Paid | Tax Assessment Tax Assessment Total Assessment is a certain percentage of the fair market value that is determined by local assessors to be the total taxable value of land and additions on the property. | Land | Improvement |
|---|---|---|---|---|
| 2025 | $16,370 | $1,109,165 | $561,575 | $547,590 |
| 2024 | $16,370 | $1,087,421 | $550,566 | $536,855 |
| 2023 | $16,075 | $1,066,100 | $539,771 | $526,329 |
| 2022 | $15,746 | $1,045,199 | $529,189 | $516,010 |
| 2021 | $15,723 | $1,024,712 | $518,816 | $505,896 |
| 2020 | $15,499 | $1,014,211 | $513,500 | $500,711 |
| 2019 | $15,278 | $994,325 | $503,431 | $490,894 |
| 2018 | $15,087 | $974,828 | $493,560 | $481,268 |
| 2017 | $14,856 | $955,714 | $483,882 | $471,832 |
| 2016 | $13,958 | $936,975 | $474,395 | $462,580 |
| 2015 | $13,512 | $899,451 | $434,218 | $465,233 |
| 2014 | $12,456 | $803,082 | $387,695 | $415,387 |
Source: Public Records
Map
Nearby Homes
- 8 Oak Grove Dr Unit 201
- 71 Oak Grove Dr
- 510 Entrada Dr Unit 203
- 432 Calle de la Mesa
- 615 Calle Arboleda
- 487 Alameda Del Prado
- 10 Pebble Beach Dr
- 844 Arlene Way
- 45 Wimbledon Ct
- 120 Fairway Dr
- 64 Los Padres Cir
- 201 Deborah Ct
- 130 Fairway Dr
- 38 Plumas Cir Unit 2
- 504 Vera Cruz Ave
- 121 Cheda Ln
- 708 Seville Way
- 323 Silvio Ln Unit 4
- 715 Seville Way Unit 715
- 306 Silvio Ln Unit 204
- 31 Hollyleaf Way
- 27 Hollyleaf Way
- 24 Hollyleaf Way
- 41 Hollyleaf Way
- 20 Hollyleaf Way
- 28 Hollyleaf Way
- 23 Hollyleaf Way
- 45 Hollyleaf Way
- 19 Hollyleaf Way
- 30 Hollyleaf Way
- 16 Hollyleaf Way
- 49 Hollyleaf Way
- 16 Oak Grove Dr
- 12 Oak Grove Dr Unit 204
- 12 Oak Grove Dr Unit 203
- 12 Oak Grove Dr Unit 202
- 12 Oak Grove Dr Unit 201
- 12 Oak Grove Dr Unit 104
- 12 Oak Grove Dr Unit 102
- 12 Oak Grove Dr Unit 105