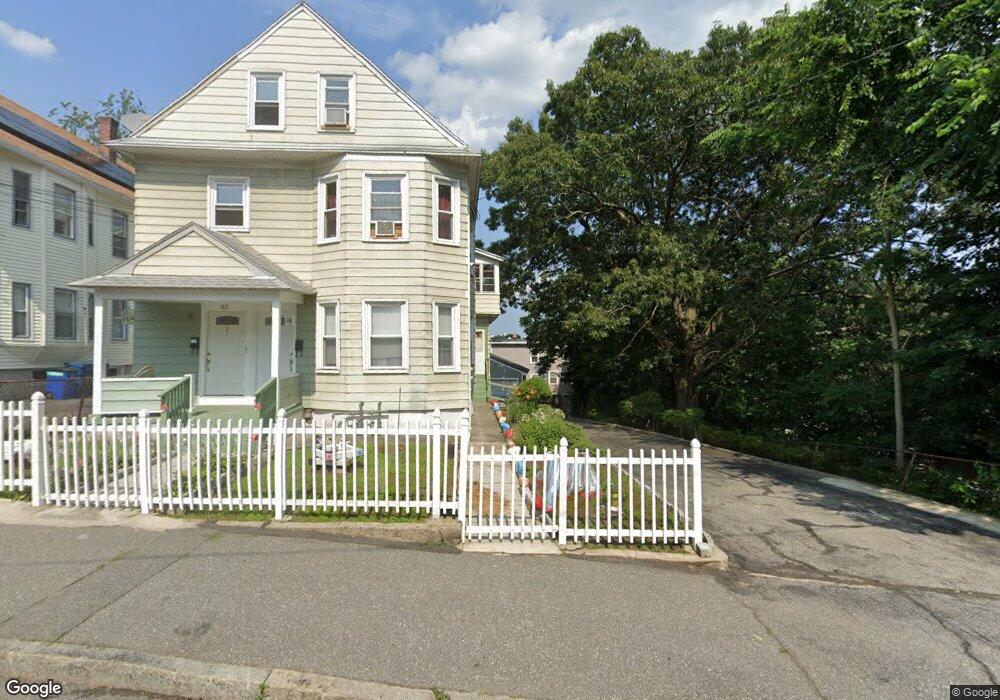
35 Howard St Unit 37 Lawrence, MA 01841
Prospect Hill-Back Bay NeighborhoodEstimated Value: $643,086 - $805,000
6
Beds
2
Baths
2,665
Sq Ft
$275/Sq Ft
Est. Value
About This Home
This home is located at 35 Howard St Unit 37, Lawrence, MA 01841 and is currently estimated at $732,772, approximately $274 per square foot. 35 Howard St Unit 37 is a home located in Essex County with nearby schools including School For Exceptional Studies, Community Day Charter Public School - Gateway, and Lawrence Catholic Academy.
Ownership History
Date
Name
Owned For
Owner Type
Purchase Details
Closed on
Jan 20, 2004
Sold by
Perez Rufino
Bought by
Perez Rufino and Perez Zenaida
Current Estimated Value
Purchase Details
Closed on
May 8, 2002
Sold by
Padellaro Joseph A
Bought by
Perez Rufino
Home Financials for this Owner
Home Financials are based on the most recent Mortgage that was taken out on this home.
Original Mortgage
$213,400
Interest Rate
7.18%
Mortgage Type
Purchase Money Mortgage
Create a Home Valuation Report for This Property
The Home Valuation Report is an in-depth analysis detailing your home's value as well as a comparison with similar homes in the area
Home Values in the Area
Average Home Value in this Area
Purchase History
| Date | Buyer | Sale Price | Title Company |
|---|---|---|---|
| Perez Rufino | -- | -- | |
| Perez Rufino | $220,000 | -- |
Source: Public Records
Mortgage History
| Date | Status | Borrower | Loan Amount |
|---|---|---|---|
| Previous Owner | Perez Rufino | $213,400 | |
| Previous Owner | Perez Rufino | $10,000 |
Source: Public Records
Tax History
| Year | Tax Paid | Tax Assessment Tax Assessment Total Assessment is a certain percentage of the fair market value that is determined by local assessors to be the total taxable value of land and additions on the property. | Land | Improvement |
|---|---|---|---|---|
| 2025 | $5,450 | $619,300 | $146,600 | $472,700 |
| 2024 | $5,310 | $574,100 | $141,600 | $432,500 |
| 2023 | $5,031 | $495,200 | $122,100 | $373,100 |
| 2022 | $4,608 | $402,800 | $113,300 | $289,500 |
| 2021 | $4,548 | $370,700 | $113,300 | $257,400 |
| 2020 | $4,328 | $348,200 | $90,900 | $257,300 |
| 2019 | $4,446 | $325,000 | $94,000 | $231,000 |
| 2018 | $3,954 | $276,100 | $85,500 | $190,600 |
| 2017 | $4,018 | $261,900 | $84,600 | $177,300 |
| 2016 | $3,634 | $234,300 | $56,400 | $177,900 |
| 2015 | $3,426 | $226,600 | $56,400 | $170,200 |
Source: Public Records
Map
Nearby Homes
- 52 Howard St
- 76 Allston St
- 7 Stevens Ct
- 27 Woodland Ct
- 2 Cherry St
- 109 Ferry St
- 80-82 Haverhill St
- 89 Newbury St Unit 89B
- 162 E Haverhill St
- 91 Summer St Unit 2
- 192 Union St
- 41-43 E Haverhill St
- 100 Union St
- 94 Main St
- 264 E Haverhill St Unit 2
- 270 E Haverhill St Unit 12
- 229 Jackson St
- 106 Leroy Ave
- 5 Kendrick St
- 439-441 High St
- 47-49 Howard St
- 47 Howard St Unit 49
- 53 Howard St
- 21 Storrow St
- 2 Woodland St Unit B
- 2 Woodland St Unit A
- 2 Woodland St Unit D
- 2 Woodland St Unit C
- 2 Woodland St
- 2 Woodland St Unit 2 C
- 4 Woodland St Unit 12
- 59 Howard St
- 36 Howard St
- 36 Howard St Unit 1
- 19 Storrow St Unit A
- 17 Storrow St
- 19 Storrow St
- 17 Storrow St Unit 17
- 17 Storrow St Unit 1B
- 19 Storrow St Unit 19
Your Personal Tour Guide
Ask me questions while you tour the home.