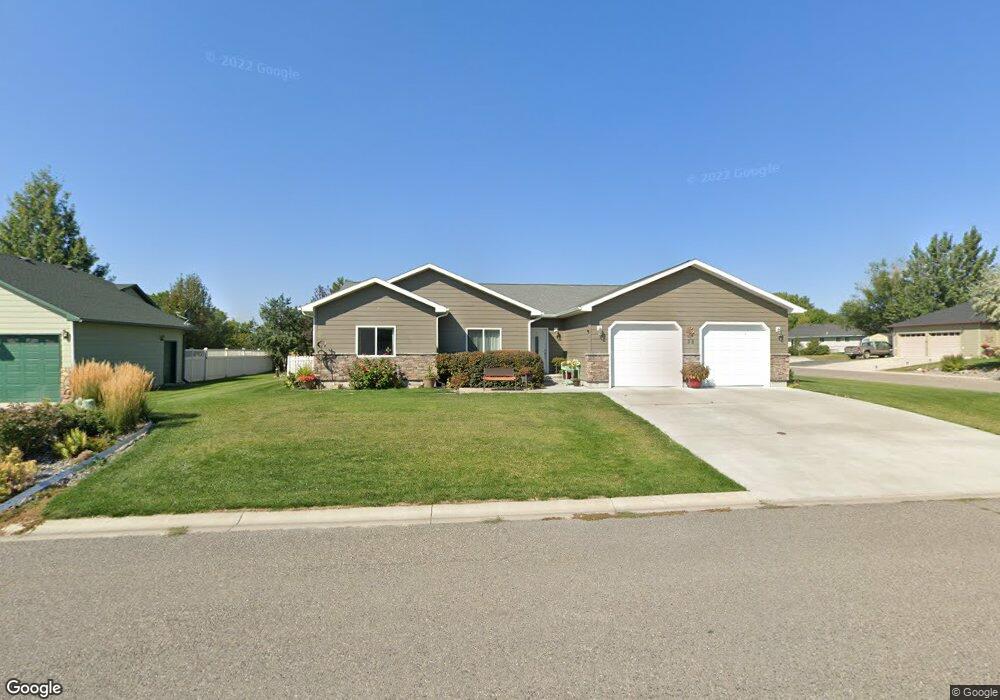
35 Johns Ln Columbus, MT 59019
Estimated Value: $347,000 - $365,000
3
Beds
2
Baths
1,783
Sq Ft
$200/Sq Ft
Est. Value
About This Home
This home is located at 35 Johns Ln, Columbus, MT 59019 and is currently estimated at $356,146, approximately $199 per square foot. 35 Johns Ln is a home located in Stillwater County with nearby schools including Columbus Elementary School and Columbus Middle School.
Ownership History
Date
Name
Owned For
Owner Type
Purchase Details
Closed on
Aug 4, 2010
Sold by
Manley Homes & Properties Llc
Bought by
Longin Edward M and Longin Sharon A
Current Estimated Value
Home Financials for this Owner
Home Financials are based on the most recent Mortgage that was taken out on this home.
Original Mortgage
$85,000
Interest Rate
4.65%
Purchase Details
Closed on
Jun 30, 2009
Sold by
Thompson Neva
Bought by
Manley Homes & Properties Llc
Purchase Details
Closed on
Jun 19, 2007
Sold by
Jrm Corporation
Bought by
Thompson Neva
Home Financials for this Owner
Home Financials are based on the most recent Mortgage that was taken out on this home.
Original Mortgage
$39,491
Interest Rate
6.14%
Create a Home Valuation Report for This Property
The Home Valuation Report is an in-depth analysis detailing your home's value as well as a comparison with similar homes in the area
Purchase History
| Date | Buyer | Sale Price | Title Company |
|---|---|---|---|
| Longin Edward M | -- | -- | |
| Manley Homes & Properties Llc | -- | -- | |
| Thompson Neva | -- | -- |
Source: Public Records
Mortgage History
| Date | Status | Borrower | Loan Amount |
|---|---|---|---|
| Closed | Longin Edward M | $85,000 | |
| Previous Owner | Thompson Neva | $39,491 |
Source: Public Records
Tax History
| Year | Tax Paid | Tax Assessment Tax Assessment Total Assessment is a certain percentage of the fair market value that is determined by local assessors to be the total taxable value of land and additions on the property. | Land | Improvement |
|---|---|---|---|---|
| 2025 | $2,072 | $399,500 | $0 | $0 |
| 2024 | $2,848 | $365,700 | $0 | $0 |
| 2023 | $2,763 | $365,700 | $0 | $0 |
| 2022 | $2,398 | $293,700 | $0 | $0 |
| 2021 | $2,425 | $293,700 | $0 | $0 |
| 2020 | $2,089 | $251,600 | $0 | $0 |
| 2019 | $2,262 | $251,600 | $0 | $0 |
| 2018 | $2,029 | $244,100 | $0 | $0 |
| 2017 | $2,008 | $244,100 | $0 | $0 |
| 2016 | $1,790 | $214,800 | $0 | $0 |
| 2015 | $1,755 | $214,800 | $0 | $0 |
| 2014 | $1,557 | $104,584 | $0 | $0 |
Source: Public Records
Map
Nearby Homes
- 407 Granite Peak Dr
- TBD Centennial Rd
- 345 N 3rd St
- 241 N 4th St
- 219 4th St
- 526 E 2nd Ave N
- 723 E 3rd Ave S
- 403 11th St N
- 1110 E 3rd Ave N
- 1131 E 3rd Ave N
- 158 N Fork Eagle Mountain Rd
- 94 Upper Flat Rd
- 30 Bear Wolf
- 79 Myers Rd
- 79 Meyers Rd
- 42 Bozeman Trail
- 26 Yates Rd
- 26 O'Dare Dr
- 630 Rapelje Rd
- 564a Countryman Creek Rd