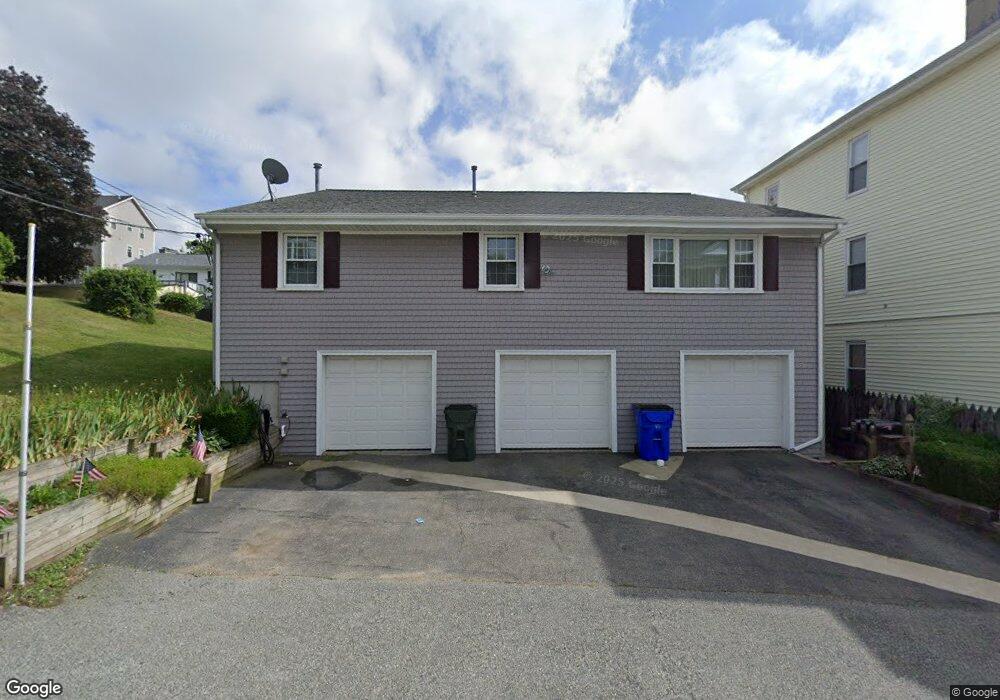
35 Jones St Unit 2 Fall River, MA 02720
Western Fall River NeighborhoodEstimated Value: $280,173 - $372,000
2
Beds
1
Bath
1,013
Sq Ft
$315/Sq Ft
Est. Value
About This Home
This home is located at 35 Jones St Unit 2, Fall River, MA 02720 and is currently estimated at $319,043, approximately $314 per square foot. 35 Jones St Unit 2 is a home located in Bristol County with nearby schools including James Tansey Elementary School, Morton Middle School, and B M C Durfee High School.
Ownership History
Date
Name
Owned For
Owner Type
Purchase Details
Closed on
Jul 31, 2009
Sold by
Carreiro Gabriel R
Bought by
Pilkington Brad P
Current Estimated Value
Home Financials for this Owner
Home Financials are based on the most recent Mortgage that was taken out on this home.
Original Mortgage
$56,800
Outstanding Balance
$37,447
Interest Rate
5.43%
Mortgage Type
Purchase Money Mortgage
Estimated Equity
$281,596
Purchase Details
Closed on
Jun 25, 1990
Sold by
Boulay Lawrence R
Bought by
Mendes Beatrice A
Home Financials for this Owner
Home Financials are based on the most recent Mortgage that was taken out on this home.
Original Mortgage
$50,000
Interest Rate
10.39%
Mortgage Type
Purchase Money Mortgage
Purchase Details
Closed on
May 20, 1987
Sold by
Mendes Beatrice A
Bought by
Boulay Lawrence R
Home Financials for this Owner
Home Financials are based on the most recent Mortgage that was taken out on this home.
Original Mortgage
$65,600
Interest Rate
9.48%
Mortgage Type
Purchase Money Mortgage
Create a Home Valuation Report for This Property
The Home Valuation Report is an in-depth analysis detailing your home's value as well as a comparison with similar homes in the area
Home Values in the Area
Average Home Value in this Area
Purchase History
| Date | Buyer | Sale Price | Title Company |
|---|---|---|---|
| Pilkington Brad P | $71,000 | -- | |
| Mendes Beatrice A | $64,500 | -- | |
| Boulay Lawrence R | $82,000 | -- |
Source: Public Records
Mortgage History
| Date | Status | Borrower | Loan Amount |
|---|---|---|---|
| Open | Pilkington Brad P | $56,800 | |
| Previous Owner | Boulay Lawrence R | $899,913 | |
| Previous Owner | Boulay Lawrence R | $50,000 | |
| Previous Owner | Boulay Lawrence R | $65,600 |
Source: Public Records
Tax History
| Year | Tax Paid | Tax Assessment Tax Assessment Total Assessment is a certain percentage of the fair market value that is determined by local assessors to be the total taxable value of land and additions on the property. | Land | Improvement |
|---|---|---|---|---|
| 2025 | $2,581 | $225,400 | $0 | $225,400 |
| 2024 | $2,334 | $203,100 | $0 | $203,100 |
| 2023 | $2,306 | $187,900 | $0 | $187,900 |
| 2022 | $2,196 | $174,000 | $0 | $174,000 |
| 2021 | $2,105 | $152,200 | $0 | $152,200 |
| 2020 | $1,568 | $108,500 | $0 | $108,500 |
| 2019 | $1,525 | $104,600 | $0 | $104,600 |
| 2018 | $1,506 | $103,000 | $0 | $103,000 |
| 2017 | $1,442 | $103,000 | $0 | $103,000 |
| 2016 | $1,366 | $100,200 | $0 | $100,200 |
| 2015 | $1,338 | $102,300 | $0 | $102,300 |
| 2014 | $1,385 | $110,100 | $0 | $110,100 |
Source: Public Records
Map
Nearby Homes
- 108 Stowe St Unit 108
- 195 Crescent St Unit 3
- 29 Valentine St
- 17 Langley St
- 333 Langley St
- 164 Narragansett St
- 208 Florence St
- 160 Stewart St
- 131 Stewart St Unit 2
- 131 Stewart St Unit 3A
- 1810 Highland Ave Unit 22
- 247 Albany St
- 102 Vestal St
- 82 Wellington St
- 36 Saint Mary St
- 274 Archer St
- 213 Weetamoe St
- 376 N Underwood St
- 172 Gibbs St
- 257 Calvin St
- 35 Jones St
- 35 Jones St Unit 3
- 55 Jones St
- 121 Crescent St
- 38 Jones St
- 163 Crescent St
- 163 Crescent St Unit 2
- 7 Jones St
- 46 Harvard St
- 30 Harvard St
- 3 Jones St
- 66 Harvard St
- 65 Jones St
- 22 Harvard St
- 66 Jones St
- 1933 N Main St
- 93 Crescent St Unit 1
- 93 Crescent St Unit 1E
- 1917 N Main St
- 1909 N Main St Unit 1
Your Personal Tour Guide
Ask me questions while you tour the home.