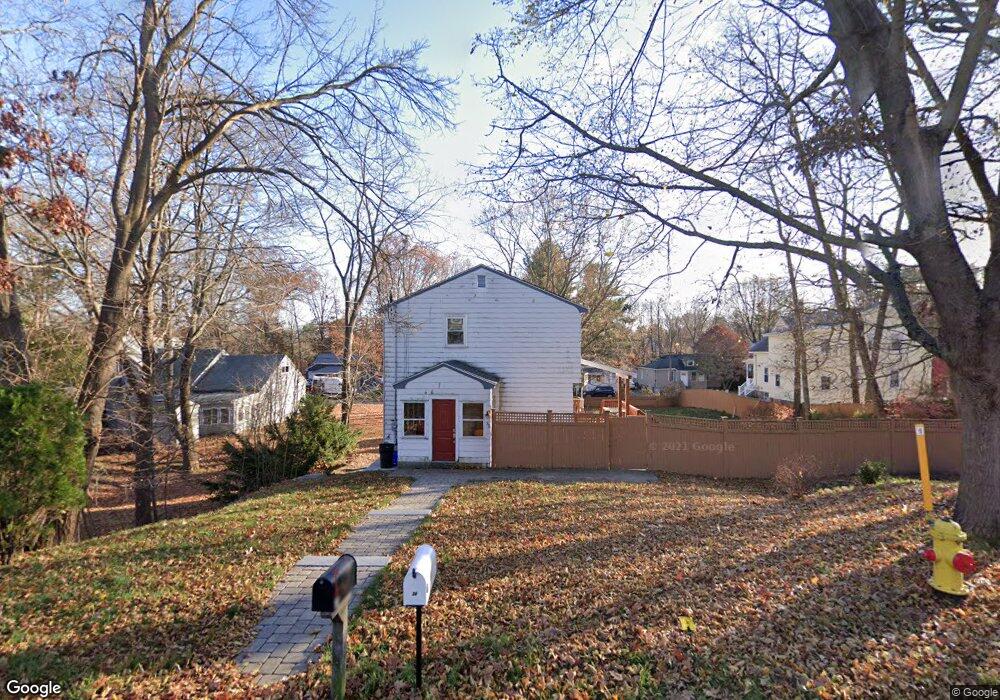
35 Juliette St Andover, MA 01810
Shawsheen Heights NeighborhoodEstimated Value: $548,000 - $713,000
4
Beds
2
Baths
1,372
Sq Ft
$454/Sq Ft
Est. Value
About This Home
This home is located at 35 Juliette St, Andover, MA 01810 and is currently estimated at $623,559, approximately $454 per square foot. 35 Juliette St is a home located in Essex County with nearby schools including West Elementary School, Andover West Middle School, and Andover High School.
Ownership History
Date
Name
Owned For
Owner Type
Purchase Details
Closed on
May 27, 2022
Sold by
Tacy Becca
Bought by
Diodati Richard R and Diodati Elizabeth A
Current Estimated Value
Home Financials for this Owner
Home Financials are based on the most recent Mortgage that was taken out on this home.
Original Mortgage
$638,226
Outstanding Balance
$602,558
Interest Rate
4.75%
Mortgage Type
FHA
Estimated Equity
$21,001
Purchase Details
Closed on
Jan 12, 2018
Sold by
Tacy Ryan
Bought by
Tacy Becca
Purchase Details
Closed on
Oct 17, 2008
Sold by
Deutsche Bank Natl T and Saxon Mortgage Svcs In
Bought by
Tacy Ryan and Tacy Becca
Purchase Details
Closed on
Jul 2, 2008
Sold by
Peralta Jose M and Deutsche Bank Natl T C
Bought by
Deutsche Bank Natl T C
Purchase Details
Closed on
Apr 24, 2006
Sold by
Bank Of America Na
Bought by
Peralta Jose and Peralta Sonia
Purchase Details
Closed on
Oct 31, 1989
Sold by
Cob Sidney
Bought by
Ferrell Jane
Create a Home Valuation Report for This Property
The Home Valuation Report is an in-depth analysis detailing your home's value as well as a comparison with similar homes in the area
Home Values in the Area
Average Home Value in this Area
Purchase History
| Date | Buyer | Sale Price | Title Company |
|---|---|---|---|
| Diodati Richard R | $650,000 | None Available | |
| Tacy Becca | -- | -- | |
| Tacy Becca | -- | -- | |
| Tacy Ryan | $255,900 | -- | |
| Tacy Ryan | $255,900 | -- | |
| Deutsche Bank Natl T C | $251,515 | -- | |
| Deutsche Bank Natl T C | $251,515 | -- | |
| Peralta Jose | $330,300 | -- | |
| Peralta Jose | $330,300 | -- | |
| Ferrell Jane | $157,500 | -- | |
| Ferrell Jane | $157,500 | -- |
Source: Public Records
Mortgage History
| Date | Status | Borrower | Loan Amount |
|---|---|---|---|
| Open | Diodati Richard R | $638,226 | |
| Previous Owner | Ferrell Jane | $285,408 |
Source: Public Records
Tax History
| Year | Tax Paid | Tax Assessment Tax Assessment Total Assessment is a certain percentage of the fair market value that is determined by local assessors to be the total taxable value of land and additions on the property. | Land | Improvement |
|---|---|---|---|---|
| 2024 | $6,354 | $493,300 | $240,400 | $252,900 |
| 2023 | $6,066 | $444,100 | $216,400 | $227,700 |
| 2022 | $5,698 | $390,300 | $188,100 | $202,200 |
| 2021 | $5,449 | $356,400 | $171,200 | $185,200 |
| 2020 | $5,222 | $347,900 | $166,800 | $181,100 |
| 2019 | $5,175 | $338,900 | $161,800 | $177,100 |
| 2018 | $4,972 | $317,900 | $155,500 | $162,400 |
| 2017 | $4,759 | $313,500 | $152,500 | $161,000 |
| 2016 | $4,646 | $313,500 | $152,500 | $161,000 |
| 2015 | $4,461 | $298,000 | $146,500 | $151,500 |
Source: Public Records
Map
Nearby Homes
- 116 Weare St
- 102 Weare St
- 10 Dartmouth Rd
- 12B Stevens St
- 34 Martingale Ln Unit 34
- 53 Martingale Ln
- 354 N Main St Unit 204
- 43 Gorham St
- 21 Clubview Dr Unit 21
- 42 York St
- 11 W Hawley St
- 24 Inman St Unit 4
- 16 Balmoral St Unit 214
- 341 S Broadway- Parcel II
- 34 Beaconsfield St
- 87-87A Brookfield St
- 11 Swan Ln Unit 11
- 17 Carisbrooke St
- 28 Stirling St
- 25 Clubview Dr Unit 25
Your Personal Tour Guide
Ask me questions while you tour the home.