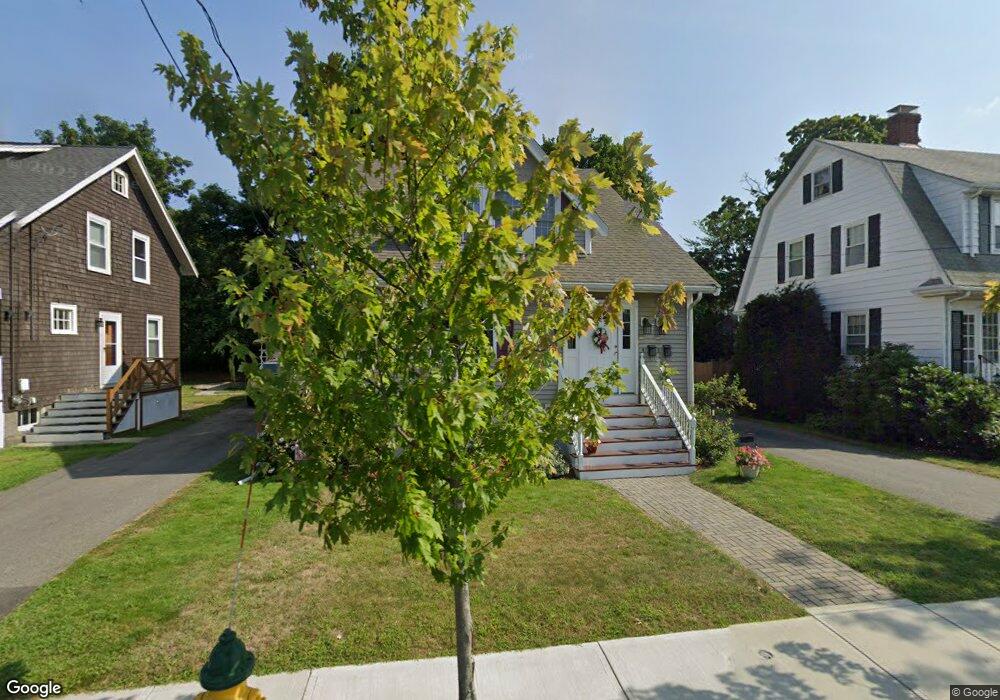
35 Lafayette St Quincy, MA 02169
Quincy Center NeighborhoodEstimated Value: $654,000 - $712,000
3
Beds
1
Bath
1,400
Sq Ft
$485/Sq Ft
Est. Value
About This Home
This home is located at 35 Lafayette St, Quincy, MA 02169 and is currently estimated at $678,930, approximately $484 per square foot. 35 Lafayette St is a home located in Norfolk County with nearby schools including Merrymount Elementary School, Central Middle School, and Quincy High School.
Ownership History
Date
Name
Owned For
Owner Type
Purchase Details
Closed on
Dec 21, 1993
Sold by
Myers Nancy
Bought by
Burke Martin and Burke Joe
Current Estimated Value
Home Financials for this Owner
Home Financials are based on the most recent Mortgage that was taken out on this home.
Original Mortgage
$110,000
Interest Rate
7.03%
Mortgage Type
Purchase Money Mortgage
Create a Home Valuation Report for This Property
The Home Valuation Report is an in-depth analysis detailing your home's value as well as a comparison with similar homes in the area
Home Values in the Area
Average Home Value in this Area
Purchase History
| Date | Buyer | Sale Price | Title Company |
|---|---|---|---|
| Burke Martin | $129,500 | -- |
Source: Public Records
Mortgage History
| Date | Status | Borrower | Loan Amount |
|---|---|---|---|
| Closed | Burke Martin | $110,000 |
Source: Public Records
Tax History Compared to Growth
Tax History
| Year | Tax Paid | Tax Assessment Tax Assessment Total Assessment is a certain percentage of the fair market value that is determined by local assessors to be the total taxable value of land and additions on the property. | Land | Improvement |
|---|---|---|---|---|
| 2025 | $6,392 | $554,400 | $267,700 | $286,700 |
| 2024 | $6,077 | $539,200 | $254,900 | $284,300 |
| 2023 | $5,539 | $497,700 | $231,800 | $265,900 |
| 2022 | $5,573 | $465,200 | $210,700 | $254,500 |
| 2021 | $5,535 | $455,900 | $210,700 | $245,200 |
| 2020 | $5,377 | $432,600 | $200,700 | $231,900 |
| 2019 | $4,947 | $394,200 | $189,300 | $204,900 |
| 2018 | $5,153 | $386,300 | $189,300 | $197,000 |
| 2017 | $5,219 | $368,300 | $180,300 | $188,000 |
| 2016 | $5,125 | $356,900 | $171,700 | $185,200 |
| 2015 | $4,897 | $335,400 | $171,700 | $163,700 |
| 2014 | $4,537 | $305,300 | $163,500 | $141,800 |
Source: Public Records
Map
Nearby Homes
- 74 Butler Rd
- 20 Putnam St
- 1025 Hancock St Unit 2K
- 77 Adams St Unit 610
- 1 Adams St Unit 707
- 20 Whitney Rd Unit 1
- 10 Presidents Ln Unit 10
- 1427 Quincy Shore Dr
- 1421 Quincy Shore Dr
- 45 Oval Rd Unit 6
- 105 Sea St Unit 301
- 105 Sea St Unit 203
- 105 Sea St Unit 105
- 165 Old Colony Ave Unit A
- 188 Samoset Ave
- 163 Clay St Unit C
- 22 Newton Ave
- 200 Adams St
- 72 Oakland Ave
- 100 Thornton St
- 33 Lafayette St
- 39 Lafayette St
- 29 Lafayette St
- 29 Lafayette St Unit 1
- 108 Butler Rd
- 102 Butler Rd
- 112 Butler Rd
- 98 Butler Rd
- 25 Lafayette St
- 43 Lafayette St
- 32 Lafayette St
- 26 Lafayette St
- 118 Butler Rd
- 94 Butler Rd
- 21 Lafayette St
- 22 Lafayette St
- 22 Lafayette St Unit 2
- 231 Southern Artery
- 90 Butler Rd
- 90 Butler Rd Unit 1