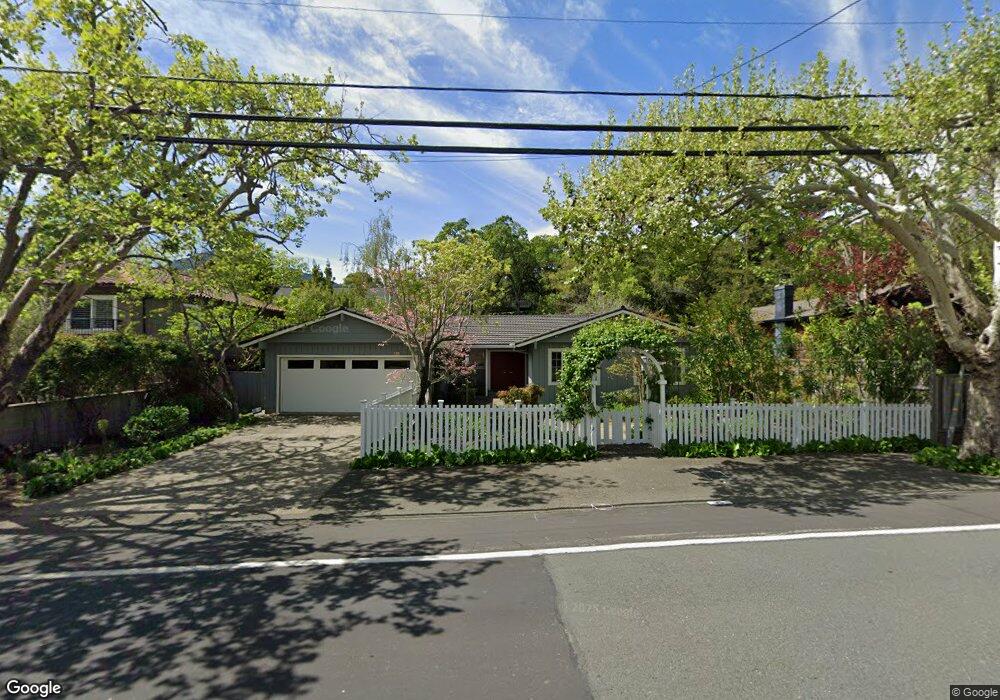
35 Laurel Grove Ave Kentfield, CA 94904
Estimated Value: $1,955,519 - $2,552,000
4
Beds
4
Baths
3,000
Sq Ft
$785/Sq Ft
Est. Value
About This Home
This home is located at 35 Laurel Grove Ave, Kentfield, CA 94904 and is currently estimated at $2,355,880, approximately $785 per square foot. 35 Laurel Grove Ave is a home located in Marin County with nearby schools including Anthony G. Bacich Elementary School, Adaline E. Kent Middle School, and Redwood High School.
Ownership History
Date
Name
Owned For
Owner Type
Purchase Details
Closed on
Dec 30, 1997
Sold by
Reilly Ulla W
Bought by
Reilly Ulla W
Current Estimated Value
Home Financials for this Owner
Home Financials are based on the most recent Mortgage that was taken out on this home.
Original Mortgage
$30,000
Interest Rate
7.31%
Mortgage Type
Credit Line Revolving
Purchase Details
Closed on
Nov 20, 1997
Sold by
Reilly Ulla W
Bought by
Reilly Ulla W
Home Financials for this Owner
Home Financials are based on the most recent Mortgage that was taken out on this home.
Original Mortgage
$30,000
Interest Rate
7.31%
Mortgage Type
Credit Line Revolving
Purchase Details
Closed on
Feb 14, 1997
Sold by
Reilly Ulla W
Bought by
Reilly Ulla W
Create a Home Valuation Report for This Property
The Home Valuation Report is an in-depth analysis detailing your home's value as well as a comparison with similar homes in the area
Home Values in the Area
Average Home Value in this Area
Purchase History
| Date | Buyer | Sale Price | Title Company |
|---|---|---|---|
| Reilly Ulla W | -- | -- | |
| Reilly Ulla W | -- | First American Title Co | |
| Reilly Ulla W | -- | -- |
Source: Public Records
Mortgage History
| Date | Status | Borrower | Loan Amount |
|---|---|---|---|
| Closed | Reilly Ulla W | $30,000 | |
| Closed | Reilly Ulla W | $120,000 |
Source: Public Records
Tax History Compared to Growth
Tax History
| Year | Tax Paid | Tax Assessment Tax Assessment Total Assessment is a certain percentage of the fair market value that is determined by local assessors to be the total taxable value of land and additions on the property. | Land | Improvement |
|---|---|---|---|---|
| 2025 | $10,228 | $767,047 | $446,592 | $320,455 |
| 2024 | $10,228 | $752,009 | $437,836 | $314,173 |
| 2023 | $10,007 | $737,264 | $429,252 | $308,012 |
| 2022 | $9,942 | $722,810 | $420,836 | $301,974 |
| 2021 | $9,757 | $708,637 | $412,584 | $296,053 |
| 2020 | $9,626 | $701,373 | $408,355 | $293,018 |
| 2019 | $9,181 | $687,622 | $400,349 | $287,273 |
| 2018 | $9,072 | $674,141 | $392,500 | $281,641 |
| 2017 | $8,763 | $660,924 | $384,805 | $276,119 |
| 2016 | $9,836 | $647,966 | $377,260 | $270,706 |
| 2015 | $9,756 | $638,234 | $371,594 | $266,640 |
| 2014 | $9,225 | $625,734 | $364,316 | $261,418 |
Source: Public Records
Map
Nearby Homes
- 9 Fay Dr
- 16 Edna Ct
- 500 Via Hidalgo
- 22 Cedar Ave
- 207 D St
- 6 Madrona St
- 321 N Almenar Dr
- 87 Laurel Grove Ave
- 234 C St
- 236 C St
- 320 Via Casitas Unit 109
- 215 Picnic Ave
- 100 Black Log Rd
- 226 Bayview St
- 150 Bungalow Ave
- 50 Via Belardo Unit 12
- 505 Larkspur Plaza Dr Unit 9
- 509 C St
- 24 Boardwalk One
- 523 B St
- 33 Laurel Grove Ave
- 121 Oak Ave
- 37 Laurel Grove Ave
- 27 Laurel Grove Ave
- 32 Laurel Grove Ave
- 30 Laurel Grove Ave
- 34 Laurel Grove Ave
- 120 Oak Ave
- 119 Oak Ave
- 28 Laurel Grove Ave
- 23 Laurel Grove Ave
- 115 Oak Ave
- 39 Laurel Grove Ave
- 4 Inman Ave
- 8 Cypress Ave
- 41 Laurel Grove Ave
- 40 Laurel Grove Ave
- 8 Inman Ave
- 113 Oak Ave