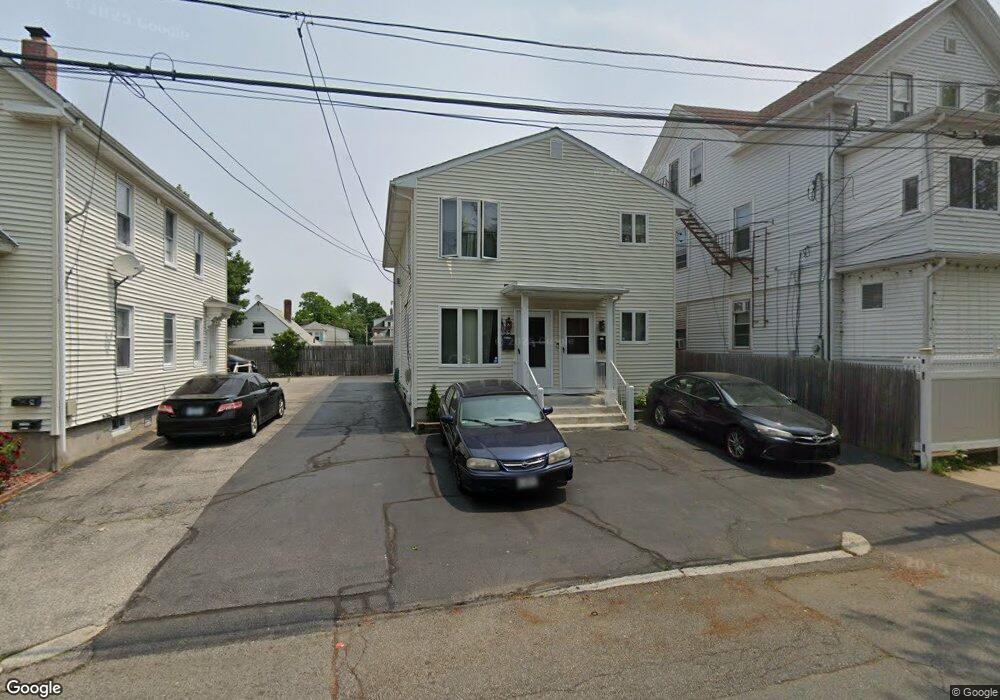
35 Lawn St Providence, RI 02908
Mount Pleasant NeighborhoodEstimated Value: $469,000 - $577,000
6
Beds
2
Baths
2,016
Sq Ft
$259/Sq Ft
Est. Value
About This Home
This home is located at 35 Lawn St, Providence, RI 02908 and is currently estimated at $521,471, approximately $258 per square foot. 35 Lawn St is a home located in Providence County with nearby schools including Charles N. Fortes Elementary School, Asa Messer Elementary School, and Veazie Street Elementary School.
Ownership History
Date
Name
Owned For
Owner Type
Purchase Details
Closed on
Jan 16, 2009
Sold by
Us Bank Na
Bought by
Caldarella David
Current Estimated Value
Purchase Details
Closed on
Nov 18, 2008
Sold by
Awoyinfa Sunday and Awoyinfa Karen
Bought by
Us Bank Na
Purchase Details
Closed on
Oct 19, 2005
Sold by
Odih Chinadu J and Odih Idayat A
Bought by
Awoyinfa Sunday and Awoyinfa Karen
Home Financials for this Owner
Home Financials are based on the most recent Mortgage that was taken out on this home.
Original Mortgage
$295,000
Interest Rate
5.72%
Mortgage Type
Purchase Money Mortgage
Purchase Details
Closed on
Aug 6, 2001
Sold by
Imonah Roseline Y
Bought by
Odih Chinadu K and Odih Idayat A
Purchase Details
Closed on
Jan 31, 1994
Sold by
Caprio David and Caprio Carolyn
Bought by
Imonah Roseline Y
Create a Home Valuation Report for This Property
The Home Valuation Report is an in-depth analysis detailing your home's value as well as a comparison with similar homes in the area
Home Values in the Area
Average Home Value in this Area
Purchase History
Date | Buyer | Sale Price | Title Company |
---|---|---|---|
Caldarella David | $125,000 | -- | |
Us Bank Na | $108,000 | -- | |
Awoyinfa Sunday | $295,000 | -- | |
Odih Chinadu K | $138,000 | -- | |
Imonah Roseline Y | $118,000 | -- |
Source: Public Records
Mortgage History
Date | Status | Borrower | Loan Amount |
---|---|---|---|
Previous Owner | Imonah Roseline Y | $295,000 | |
Previous Owner | Imonah Roseline Y | $188,000 | |
Previous Owner | Imonah Roseline Y | $159,215 |
Source: Public Records
Tax History Compared to Growth
Tax History
Year | Tax Paid | Tax Assessment Tax Assessment Total Assessment is a certain percentage of the fair market value that is determined by local assessors to be the total taxable value of land and additions on the property. | Land | Improvement |
---|---|---|---|---|
2024 | $6,711 | $365,700 | $87,100 | $278,600 |
2023 | $6,711 | $365,700 | $87,100 | $278,600 |
2022 | $6,509 | $365,700 | $87,100 | $278,600 |
2021 | $5,673 | $231,000 | $51,300 | $179,700 |
2020 | $5,673 | $231,000 | $51,300 | $179,700 |
2019 | $5,673 | $231,000 | $51,300 | $179,700 |
2018 | $5,312 | $166,200 | $46,600 | $119,600 |
2017 | $5,312 | $166,200 | $46,600 | $119,600 |
2016 | $5,312 | $166,200 | $46,600 | $119,600 |
2015 | $4,783 | $144,500 | $46,600 | $97,900 |
2014 | $4,877 | $144,500 | $46,600 | $97,900 |
2013 | $4,877 | $144,500 | $46,600 | $97,900 |
Source: Public Records
Map
Nearby Homes
- 342 Academy Ave
- 36 Lindy Ave
- 88 Beaufort St
- 53 Winthrop Ave
- 94 Waller St
- 189 Home Ave
- 12 Tiffany St
- 90 Winthrop Ave
- 26 Standish Ave
- 1517 Amity St
- 1314 Chalkstone Ave
- 66 Grosvenor Ave
- 35 Mount Pleasant Ave
- 103 Jastram St
- 249 Whitford Ave
- 507 Pleasant Valley Pkwy
- 55 Alton St
- 16 Elmcroft Ave
- 22 Gage St Unit 1A
- 129 Academy Ave