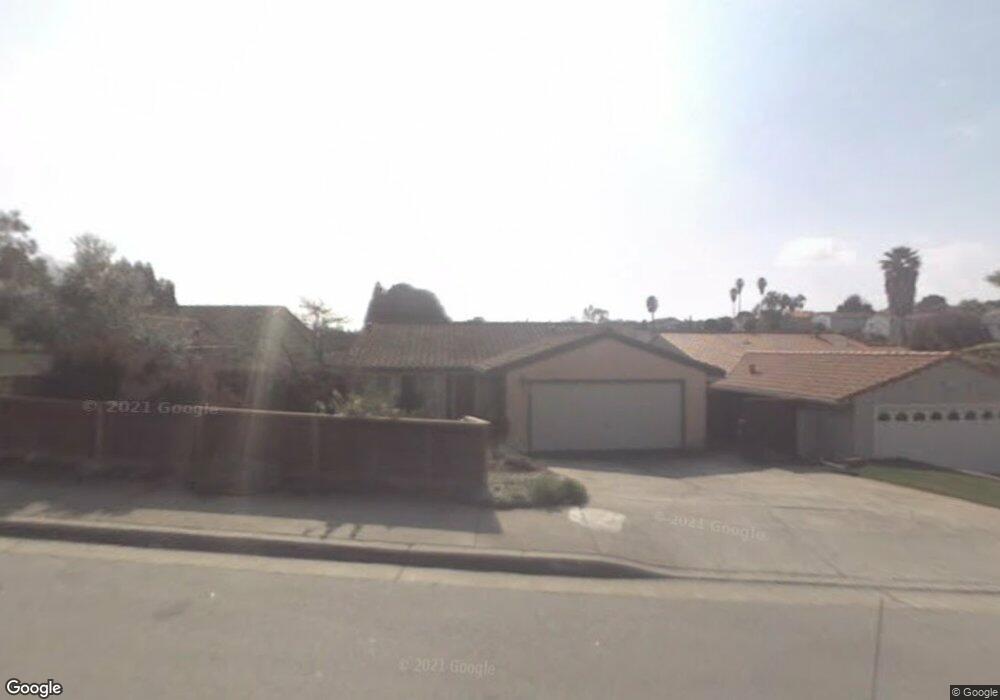
35 Lawrence Ave Watsonville, CA 95076
Estimated Value: $816,000 - $906,065
3
Beds
2
Baths
1,973
Sq Ft
$437/Sq Ft
Est. Value
About This Home
This home is located at 35 Lawrence Ave, Watsonville, CA 95076 and is currently estimated at $861,766, approximately $436 per square foot. 35 Lawrence Ave is a home located in Santa Cruz County with nearby schools including Freedom Elementary School, Rolling Hills Middle School, and Pajaro Valley High School.
Ownership History
Date
Name
Owned For
Owner Type
Purchase Details
Closed on
Aug 19, 2020
Sold by
Bice Jeffrey G and Bice Janet Marie
Bought by
Bice J Graham J and Bice Janet M
Current Estimated Value
Home Financials for this Owner
Home Financials are based on the most recent Mortgage that was taken out on this home.
Original Mortgage
$50,000
Interest Rate
3%
Mortgage Type
Credit Line Revolving
Purchase Details
Closed on
Nov 19, 2015
Sold by
Bice Jeffrey G and Bice Janet Marie
Bought by
The Jeffrey Graham Bice & Janet Marie Bi
Home Financials for this Owner
Home Financials are based on the most recent Mortgage that was taken out on this home.
Original Mortgage
$153,000
Interest Rate
3.76%
Mortgage Type
New Conventional
Purchase Details
Closed on
Jun 14, 2005
Sold by
Bice J Graham J and Bice Janet Marie
Bought by
Bice J Graham J and Bice Janet M
Create a Home Valuation Report for This Property
The Home Valuation Report is an in-depth analysis detailing your home's value as well as a comparison with similar homes in the area
Home Values in the Area
Average Home Value in this Area
Purchase History
| Date | Buyer | Sale Price | Title Company |
|---|---|---|---|
| Bice J Graham J | -- | First American Title Company | |
| Bice Jeffrey G | -- | First American Title Company | |
| The Jeffrey Graham Bice & Janet Marie Bi | -- | Accommodation | |
| Bice Jeffrey G | -- | Old Republic Title Company | |
| Bice J Graham J | -- | -- |
Source: Public Records
Mortgage History
| Date | Status | Borrower | Loan Amount |
|---|---|---|---|
| Closed | Bice Jeffrey G | $50,000 | |
| Closed | Bice Jeffrey G | $153,000 |
Source: Public Records
Tax History Compared to Growth
Tax History
| Year | Tax Paid | Tax Assessment Tax Assessment Total Assessment is a certain percentage of the fair market value that is determined by local assessors to be the total taxable value of land and additions on the property. | Land | Improvement |
|---|---|---|---|---|
| 2025 | $3,891 | $338,802 | $133,989 | $204,813 |
| 2023 | $3,831 | $325,646 | $128,786 | $196,860 |
| 2022 | $3,761 | $319,261 | $126,261 | $193,000 |
| 2021 | $3,779 | $313,000 | $123,785 | $189,215 |
| 2020 | $3,725 | $309,791 | $122,516 | $187,275 |
| 2019 | $3,659 | $303,716 | $120,113 | $183,603 |
| 2018 | $3,567 | $297,761 | $117,758 | $180,003 |
| 2017 | $3,455 | $291,922 | $115,449 | $176,473 |
| 2016 | $3,364 | $286,198 | $113,185 | $173,013 |
| 2015 | $3,351 | $281,899 | $111,485 | $170,414 |
| 2014 | $3,278 | $276,377 | $109,301 | $167,076 |
Source: Public Records
Map
Nearby Homes
- 501 S Green Valley Rd Unit 89
- 52 Winding Way
- 61 Shady Oaks Dr
- 8 Kralj Dr
- 45 Crescent Dr
- 66 Contento Dr Unit 66
- 149 Cherry Blossom Dr
- 26 Oliveira Loop
- 144 Holm Rd Unit 55
- 144 Holm Rd Unit 5
- 144 Holm Rd Unit 93
- 144 Holm Rd Unit 112
- 99 Sincero Dr Unit 99
- 40 Eileen St
- 417 Annie Dr
- 221 Carey Ave Unit A
- 38 Clifford Ave
- 444 Sherwood Ct
- 127 Terry Loop
- 27 Burchell Ave
- 31 Lawrence Ave
- 39 Lawrence Ave
- 25 Lawrence Ave
- 31 Magnolia Dr
- 15 Magnolia Ct
- 7 Magnolia Ct
- 19 Lawrence Ave
- 38 Lawrence Ave
- 2 Honeysuckle Dr
- 26 Lawrence Ave
- 44 Lawrence Ave
- 20 Lawrence Ave
- 50 Lawrence Ave
- 13 Lawrence Ave
- 15 Honeysuckle Dr
- 23 Magnolia Ct
- 30 Magnolia Dr
- 34 Magnolia Dr
- 14 Lawrence Ave
- 56 Lawrence Ave