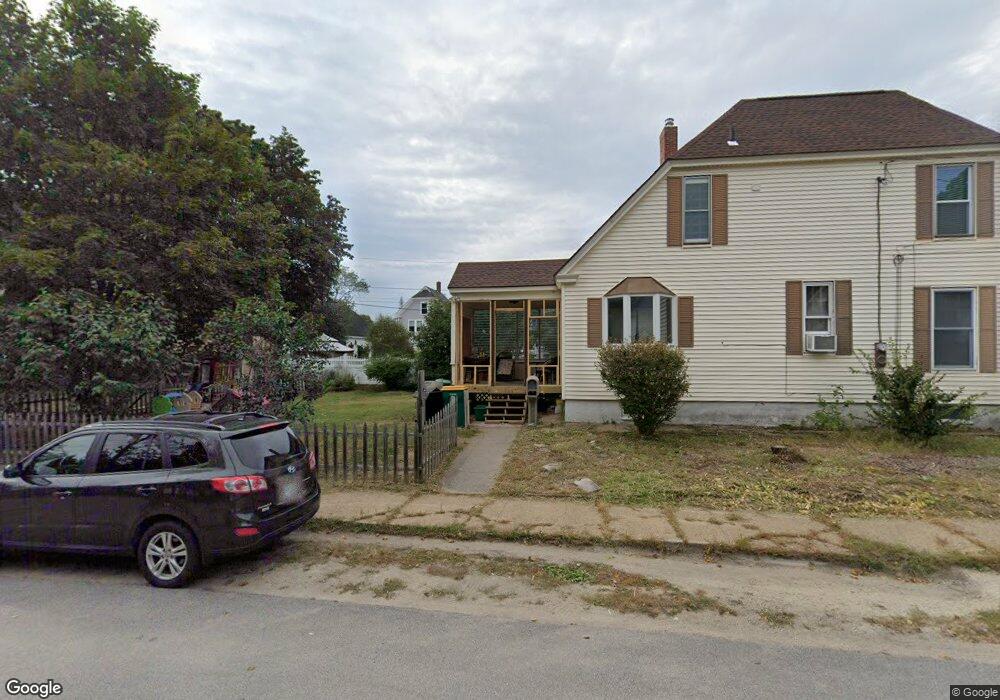
35 Linden St Rochester, NH 03867
Estimated Value: $454,000 - $538,698
3
Beds
3
Baths
1,856
Sq Ft
$270/Sq Ft
Est. Value
About This Home
This home is located at 35 Linden St, Rochester, NH 03867 and is currently estimated at $501,175, approximately $270 per square foot. 35 Linden St is a home located in Strafford County with nearby schools including School Street School, Rochester Middle School, and Spaulding High School.
Ownership History
Date
Name
Owned For
Owner Type
Purchase Details
Closed on
Feb 10, 2023
Sold by
Restore Alignment Prop Ll
Bought by
Baker Joshua and Baker Carrie L
Current Estimated Value
Home Financials for this Owner
Home Financials are based on the most recent Mortgage that was taken out on this home.
Original Mortgage
$454,212
Outstanding Balance
$439,365
Interest Rate
6.48%
Mortgage Type
Purchase Money Mortgage
Estimated Equity
$61,810
Purchase Details
Closed on
Jul 16, 2021
Sold by
Realty Investments Llc
Bought by
Restore Alignment Prop
Home Financials for this Owner
Home Financials are based on the most recent Mortgage that was taken out on this home.
Original Mortgage
$218,000
Interest Rate
2.9%
Mortgage Type
Purchase Money Mortgage
Purchase Details
Closed on
Jul 5, 2021
Sold by
Spellissy Matthew
Bought by
1 Realty Investments Llc
Home Financials for this Owner
Home Financials are based on the most recent Mortgage that was taken out on this home.
Original Mortgage
$218,000
Interest Rate
2.9%
Mortgage Type
Purchase Money Mortgage
Purchase Details
Closed on
Apr 28, 2021
Sold by
Michaud Rachel M
Bought by
1 Realty Investments Llc
Purchase Details
Closed on
Apr 20, 2021
Sold by
Clark Cellne E
Bought by
1 Realty Investments Llc
Purchase Details
Closed on
Apr 19, 2021
Sold by
Cahill Patrice C
Bought by
1 Realty Investments Llc
Purchase Details
Closed on
Nov 3, 1978
Bought by
Angers Apartments Inc
Create a Home Valuation Report for This Property
The Home Valuation Report is an in-depth analysis detailing your home's value as well as a comparison with similar homes in the area
Home Values in the Area
Average Home Value in this Area
Purchase History
| Date | Buyer | Sale Price | Title Company |
|---|---|---|---|
| Baker Joshua | $444,000 | None Available | |
| Restore Alignment Prop | $48,000 | None Available | |
| 1 Realty Investments Llc | $15,000 | None Available | |
| 1 Realty Investments Llc | -- | None Available | |
| 1 Realty Investments Llc | -- | None Available | |
| 1 Realty Investments Llc | -- | None Available | |
| 1 Realty Investments Llc | -- | None Available | |
| 1 Realty Investments Llc | -- | None Available | |
| 1 Realty Investments Llc | -- | None Available | |
| Angers Apartments Inc | -- | -- |
Source: Public Records
Mortgage History
| Date | Status | Borrower | Loan Amount |
|---|---|---|---|
| Open | Baker Joshua | $454,212 | |
| Previous Owner | Restore Alignment Prop | $218,000 |
Source: Public Records
Tax History Compared to Growth
Tax History
| Year | Tax Paid | Tax Assessment Tax Assessment Total Assessment is a certain percentage of the fair market value that is determined by local assessors to be the total taxable value of land and additions on the property. | Land | Improvement |
|---|---|---|---|---|
| 2024 | $7,691 | $517,900 | $78,900 | $439,000 |
| 2023 | $7,936 | $308,300 | $46,000 | $262,300 |
| 2022 | $5,235 | $207,100 | $46,000 | $161,100 |
| 2021 | $1,134 | $46,000 | $46,000 | $0 |
| 2020 | $1,132 | $46,000 | $46,000 | $0 |
| 2019 | $833 | $46,000 | $46,000 | $0 |
| 2018 | $804 | $31,700 | $31,700 | $0 |
| 2017 | $835 | $31,700 | $31,700 | $0 |
| 2016 | $896 | $31,700 | $31,700 | $0 |
| 2015 | $892 | $31,700 | $31,700 | $0 |
| 2014 | $871 | $31,700 | $31,700 | $0 |
| 2013 | $1,149 | $43,600 | $43,600 | $0 |
| 2012 | $1,120 | $43,600 | $43,600 | $0 |
Source: Public Records
Map
Nearby Homes
- 1 Farrington St
- 15 Linden St
- 17 Winter St
- 67 Winter St
- 38 Western Ave
- 3 Dodge St
- 45 Hanson St
- 47 Hanson St
- 10 Sarah Ct
- 32 Adams Ave
- 7 Mcintire Ct
- 57 Congress St
- 0 Franklin St Unit 55 4959653
- 56 Chamberlain St
- 35 Franklin Heights
- 22 Corson St
- 86 Wakefield St
- 105 Wakefield St
- 10 Lady Slipper Ct
- 51 Chestnut St