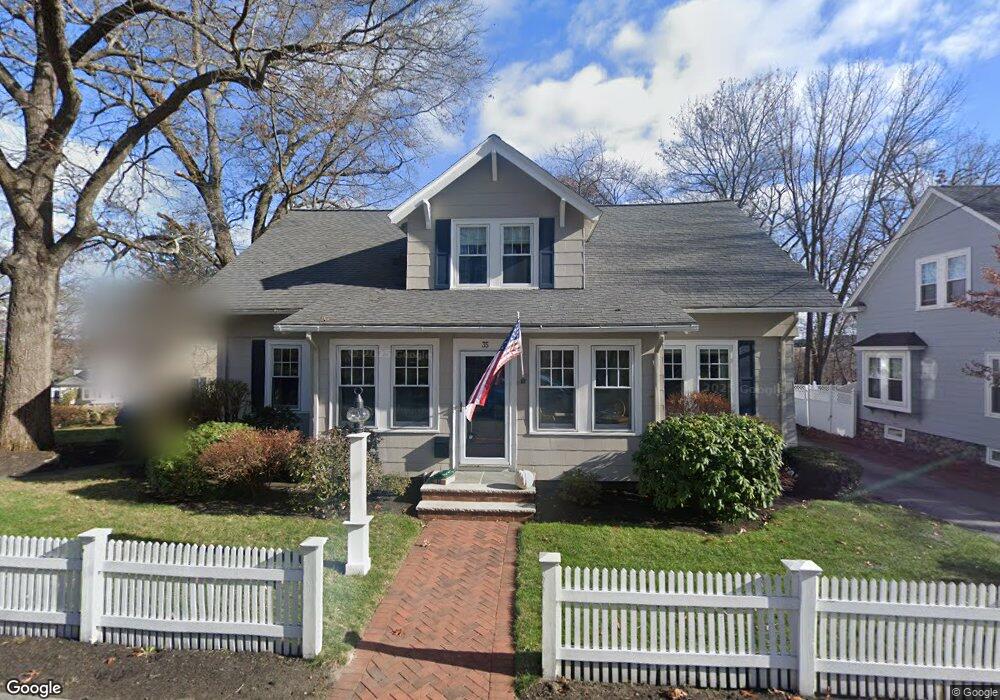
35 Magnolia Ave Andover, MA 01810
Shawsheen Heights NeighborhoodEstimated Value: $836,320 - $1,027,000
3
Beds
3
Baths
2,408
Sq Ft
$373/Sq Ft
Est. Value
About This Home
This home is located at 35 Magnolia Ave, Andover, MA 01810 and is currently estimated at $898,080, approximately $372 per square foot. 35 Magnolia Ave is a home located in Essex County with nearby schools including West Elementary School, Andover West Middle School, and Andover High School.
Ownership History
Date
Name
Owned For
Owner Type
Purchase Details
Closed on
Jun 8, 2021
Sold by
Richardson Scott E and Richardson Susan L
Bought by
Richard Ft and Richardson
Current Estimated Value
Home Financials for this Owner
Home Financials are based on the most recent Mortgage that was taken out on this home.
Original Mortgage
$103,028
Outstanding Balance
$56,945
Interest Rate
2.9%
Mortgage Type
New Conventional
Estimated Equity
$841,135
Purchase Details
Closed on
Oct 31, 2017
Sold by
Richardson Scott and Richardson Susan L
Bought by
Richarson Ft and Richardson
Purchase Details
Closed on
Jul 8, 1986
Bought by
Richardson Scott E and Richardson Susan L
Create a Home Valuation Report for This Property
The Home Valuation Report is an in-depth analysis detailing your home's value as well as a comparison with similar homes in the area
Home Values in the Area
Average Home Value in this Area
Purchase History
We collect this data history from publicly available records. To have your information removed, we recommend requesting removal directly through your county’s website.
| Date | Buyer | Sale Price | Title Company |
|---|---|---|---|
| Richard Ft | -- | Misc Company | |
| Richardson Scott E | -- | Misc Company | |
| Richard Ft | -- | Misc Company | |
| Richard Ft | -- | Misc Company | |
| Richardson Scott | -- | Misc Company | |
| Richarson Ft | -- | -- | |
| Richardson Scott E | $180,000 | -- | |
| Richarson Ft | -- | -- |
Source: Public Records
Mortgage History
We collect this data history from publicly available records. To have your information removed, we recommend requesting removal directly through your county’s website.
| Date | Status | Borrower | Loan Amount |
|---|---|---|---|
| Open | Richardson Scott | $103,028 | |
| Closed | Richardson Scott E | $103,028 | |
| Previous Owner | Richardson Scott E | $263,100 | |
| Previous Owner | Richardson Scott E | $44,000 |
Source: Public Records
Tax History
| Year | Tax Paid | Tax Assessment Tax Assessment Total Assessment is a certain percentage of the fair market value that is determined by local assessors to be the total taxable value of land and additions on the property. | Land | Improvement |
|---|---|---|---|---|
| 2025 | $9,300 | $744,600 | $342,700 | $401,900 |
| 2024 | $9,022 | $700,500 | $338,100 | $362,400 |
| 2023 | $8,611 | $630,400 | $304,500 | $325,900 |
| 2022 | $8,287 | $567,600 | $269,600 | $298,000 |
| 2021 | $7,919 | $517,900 | $245,100 | $272,800 |
| 2020 | $7,594 | $505,900 | $239,200 | $266,700 |
| 2019 | $7,407 | $485,100 | $225,500 | $259,600 |
| 2018 | $7,049 | $450,700 | $212,800 | $237,900 |
| 2017 | $6,746 | $444,400 | $208,600 | $235,800 |
| 2016 | $6,387 | $431,000 | $195,200 | $235,800 |
| 2015 | $6,130 | $409,500 | $187,700 | $221,800 |
Source: Public Records
Map
Nearby Homes
- 539-541 S Broadway
- 42 York St
- 59 William St
- 2 Amherst Rd
- 21 Clubview Dr Unit 21
- 401 S Broadway
- 17 Gorham St
- 5 Lafayette Ave
- 15-17 Stirling St
- 7 Rock o Dundee Rd
- 80 B Washington Park Dr Unit 7
- 70 Washington Park Dr Unit 6
- 11 Swan Ln Unit 11
- 20 Washington Park Dr Unit 12
- 25 Clubview Dr Unit 25
- 16R High St
- 27 Lincoln St
- 2 Dove Ln Unit 2
- 9 Muirfield Cir Unit 9
- 9 Muirfield Cir
Your Personal Tour Guide
Ask me questions while you tour the home.