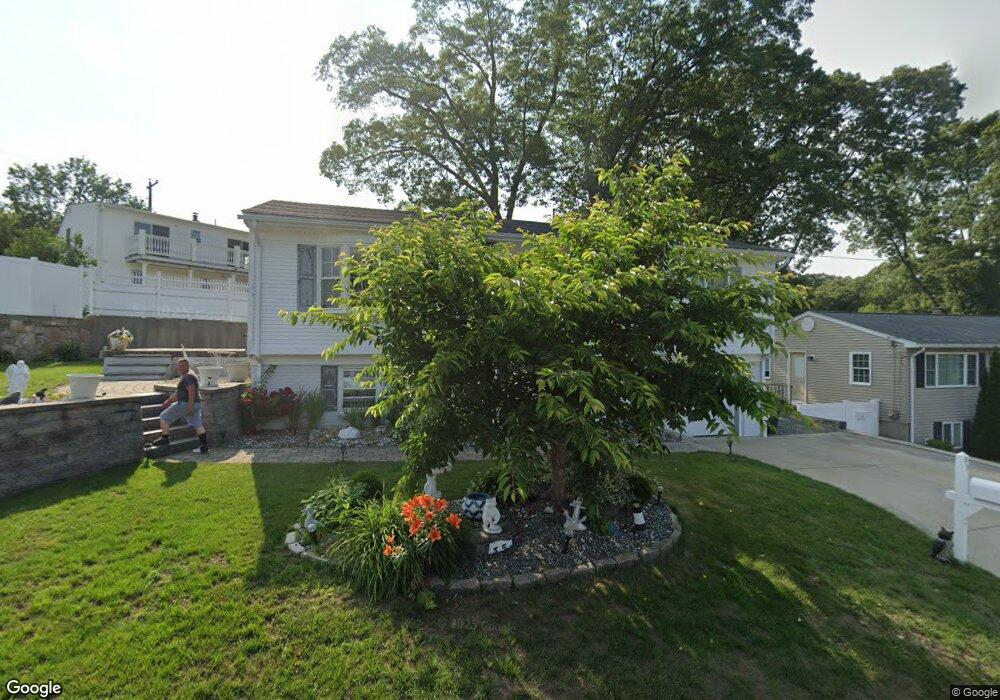
35 Malcom St Cranston, RI 02910
Eden Park NeighborhoodEstimated Value: $400,000 - $493,000
3
Beds
2
Baths
1,778
Sq Ft
$246/Sq Ft
Est. Value
About This Home
This home is located at 35 Malcom St, Cranston, RI 02910 and is currently estimated at $438,136, approximately $246 per square foot. 35 Malcom St is a home located in Providence County with nearby schools including Park View Middle School, Cranston High School East, and Cadence Academy Preschool - Cranston.
Ownership History
Date
Name
Owned For
Owner Type
Purchase Details
Closed on
Dec 21, 2021
Sold by
Pacheco Joseph and Pacheco Bertha M
Bought by
Pacheco Joseph
Current Estimated Value
Purchase Details
Closed on
Dec 7, 2018
Sold by
Pooley Mark E and Wentworth Caroline C
Bought by
Pacheco Joseph and Pacheco Bertha M
Purchase Details
Closed on
Aug 21, 2008
Sold by
Ucci Ronald and Ucci Sandra
Bought by
Pooley Mark E and Wentworth Caroline C
Home Financials for this Owner
Home Financials are based on the most recent Mortgage that was taken out on this home.
Original Mortgage
$188,000
Interest Rate
6.4%
Mortgage Type
Purchase Money Mortgage
Create a Home Valuation Report for This Property
The Home Valuation Report is an in-depth analysis detailing your home's value as well as a comparison with similar homes in the area
Home Values in the Area
Average Home Value in this Area
Purchase History
| Date | Buyer | Sale Price | Title Company |
|---|---|---|---|
| Pacheco Joseph | -- | None Available | |
| Pacheco Joseph | $265,000 | -- | |
| Pooley Mark E | $235,000 | -- |
Source: Public Records
Mortgage History
| Date | Status | Borrower | Loan Amount |
|---|---|---|---|
| Previous Owner | Pooley Mark E | $160,000 | |
| Previous Owner | Pooley Mark E | $187,000 | |
| Previous Owner | Pooley Mark E | $188,000 | |
| Previous Owner | Pooley Mark E | $22,000 |
Source: Public Records
Tax History
| Year | Tax Paid | Tax Assessment Tax Assessment Total Assessment is a certain percentage of the fair market value that is determined by local assessors to be the total taxable value of land and additions on the property. | Land | Improvement |
|---|---|---|---|---|
| 2025 | $4,876 | $351,300 | $96,000 | $255,300 |
| 2024 | $4,781 | $351,300 | $96,000 | $255,300 |
| 2023 | $4,816 | $254,800 | $66,200 | $188,600 |
| 2022 | $4,716 | $254,800 | $66,200 | $188,600 |
| 2021 | $4,586 | $254,800 | $66,200 | $188,600 |
| 2020 | $4,432 | $213,400 | $62,900 | $150,500 |
| 2019 | $4,432 | $213,400 | $62,900 | $150,500 |
| 2018 | $4,330 | $213,400 | $62,900 | $150,500 |
| 2017 | $4,177 | $182,100 | $46,300 | $135,800 |
| 2016 | $4,088 | $182,100 | $46,300 | $135,800 |
Source: Public Records
Map
Nearby Homes
Your Personal Tour Guide
Ask me questions while you tour the home.