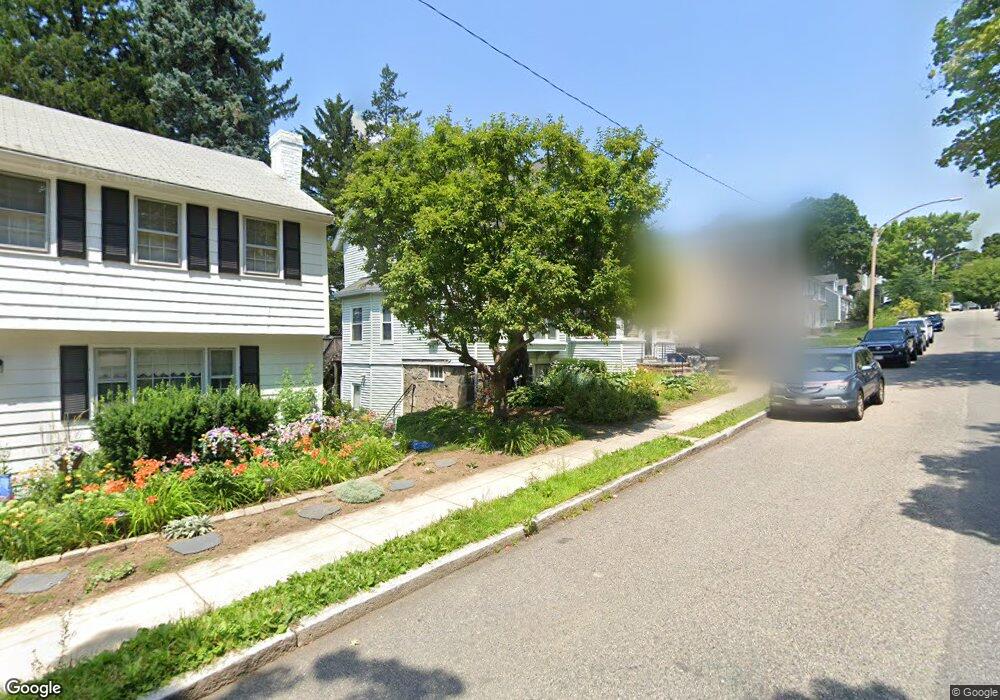
35 Maxfield St West Roxbury, MA 02132
Bellevue Hill NeighborhoodEstimated Value: $1,103,000 - $1,187,000
5
Beds
3
Baths
2,414
Sq Ft
$466/Sq Ft
Est. Value
About This Home
This home is located at 35 Maxfield St, West Roxbury, MA 02132 and is currently estimated at $1,125,610, approximately $466 per square foot. 35 Maxfield St is a home located in Suffolk County with nearby schools including St Theresa School, Holy Name Parish School, and The Roxbury Latin School.
Ownership History
Date
Name
Owned For
Owner Type
Purchase Details
Closed on
Jun 22, 2001
Sold by
Goldweitz Julie A
Bought by
Rufo Paul A
Current Estimated Value
Purchase Details
Closed on
Aug 5, 1993
Sold by
Duffy Paul and Duffy Jean
Bought by
Goldweitz Julie A and Sirmon Barry
Create a Home Valuation Report for This Property
The Home Valuation Report is an in-depth analysis detailing your home's value as well as a comparison with similar homes in the area
Home Values in the Area
Average Home Value in this Area
Purchase History
| Date | Buyer | Sale Price | Title Company |
|---|---|---|---|
| Rufo Paul A | $401,000 | -- | |
| Goldweitz Julie A | $144,000 | -- |
Source: Public Records
Mortgage History
| Date | Status | Borrower | Loan Amount |
|---|---|---|---|
| Open | Goldweitz Julie A | $340,000 | |
| Closed | Goldweitz Julie A | $322,700 |
Source: Public Records
Tax History Compared to Growth
Tax History
| Year | Tax Paid | Tax Assessment Tax Assessment Total Assessment is a certain percentage of the fair market value that is determined by local assessors to be the total taxable value of land and additions on the property. | Land | Improvement |
|---|---|---|---|---|
| 2025 | $10,964 | $946,800 | $301,700 | $645,100 |
| 2024 | $9,645 | $884,900 | $287,000 | $597,900 |
| 2023 | $8,966 | $834,800 | $270,800 | $564,000 |
| 2022 | $8,257 | $758,900 | $246,200 | $512,700 |
| 2021 | $7,862 | $736,800 | $239,000 | $497,800 |
| 2020 | $7,293 | $690,600 | $220,900 | $469,700 |
| 2019 | $6,800 | $645,200 | $183,400 | $461,800 |
| 2018 | $6,438 | $614,300 | $183,400 | $430,900 |
| 2017 | $6,439 | $608,000 | $183,400 | $424,600 |
| 2016 | $6,309 | $573,500 | $183,400 | $390,100 |
| 2015 | $6,366 | $525,700 | $153,900 | $371,800 |
| 2014 | $6,174 | $490,800 | $153,900 | $336,900 |
Source: Public Records
Map
Nearby Homes
- 54 Sturges Rd
- 348 Lagrange St
- 425 Lagrange St Unit 203
- 110 Park St Unit 3
- 27-29 Temple St
- 73 Woodard Rd
- 152 Stratford St
- 73 Dent St Unit 1
- 76 Potomac St
- 37 Hastings St Unit 103
- 275 Bellevue St
- 14 Sanborn Ave
- 539 Lagrange St
- 145 Lagrange St
- 416 Belgrade Ave Unit 25
- 2231 Centre St
- 12 Loyola Cir
- 183 Temple St
- 12 Bronx Rd
- 63 Johnson St