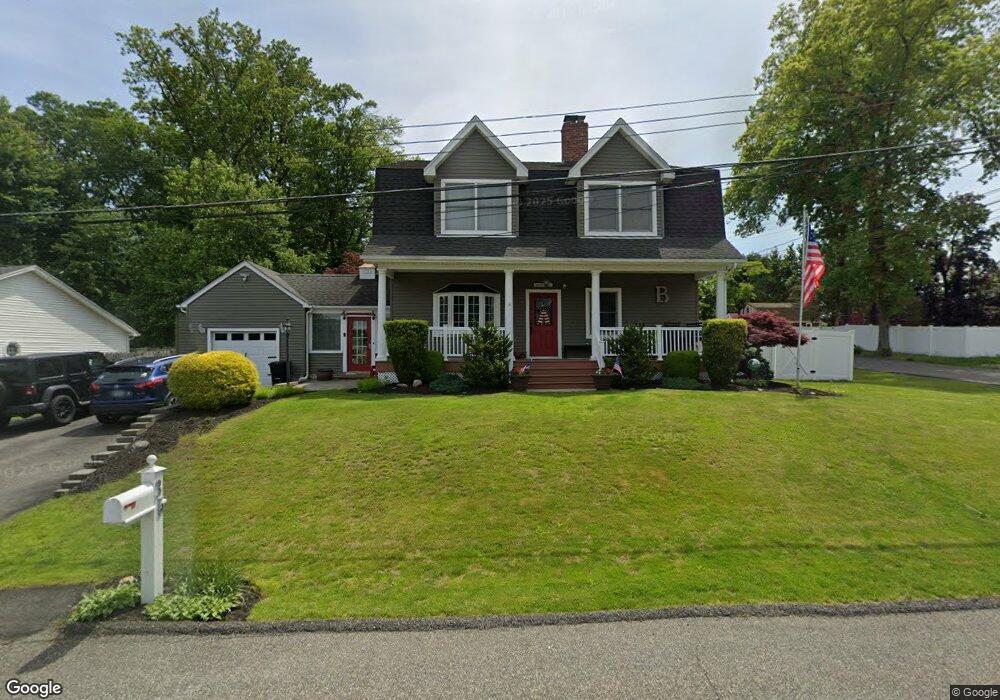
35 Minerick Dr Stony Point, NY 10980
Estimated Value: $582,983 - $690,000
3
Beds
2
Baths
1,902
Sq Ft
$326/Sq Ft
Est. Value
About This Home
This home is located at 35 Minerick Dr, Stony Point, NY 10980 and is currently estimated at $619,496, approximately $325 per square foot. 35 Minerick Dr is a home located in Rockland County with nearby schools including James A. Farley Middle School, Stony Point Elementary School, and Fieldstone Secondary School.
Ownership History
Date
Name
Owned For
Owner Type
Purchase Details
Closed on
May 2, 2001
Sold by
Dapra Linda L and Brooks Joyce C
Bought by
Burns Kevin J and Kumpf Michele L
Current Estimated Value
Home Financials for this Owner
Home Financials are based on the most recent Mortgage that was taken out on this home.
Original Mortgage
$199,500
Outstanding Balance
$74,493
Interest Rate
7.03%
Mortgage Type
Purchase Money Mortgage
Estimated Equity
$545,003
Create a Home Valuation Report for This Property
The Home Valuation Report is an in-depth analysis detailing your home's value as well as a comparison with similar homes in the area
Home Values in the Area
Average Home Value in this Area
Purchase History
| Date | Buyer | Sale Price | Title Company |
|---|---|---|---|
| Burns Kevin J | $210,000 | Commonwealth Land Title Ins |
Source: Public Records
Mortgage History
| Date | Status | Borrower | Loan Amount |
|---|---|---|---|
| Open | Burns Kevin J | $199,500 |
Source: Public Records
Tax History
| Year | Tax Paid | Tax Assessment Tax Assessment Total Assessment is a certain percentage of the fair market value that is determined by local assessors to be the total taxable value of land and additions on the property. | Land | Improvement |
|---|---|---|---|---|
| 2022 | $3,583 | $39,000 | $7,700 | $31,300 |
| 2021 | $3,583 | $39,000 | $7,700 | $31,300 |
| 2020 | $10,871 | $39,000 | $7,700 | $31,300 |
| 2019 | $3,043 | $39,000 | $7,700 | $31,300 |
| 2018 | $8,847 | $39,000 | $7,700 | $31,300 |
| 2017 | $8,681 | $39,000 | $7,700 | $31,300 |
| 2016 | $8,970 | $39,000 | $7,700 | $31,300 |
| 2015 | -- | $39,000 | $7,700 | $31,300 |
| 2014 | -- | $39,000 | $7,700 | $31,300 |
Source: Public Records
Map
Nearby Homes
- 21 Janet Place
- 4 Jay St
- 57 Mountain View Mobile Home Park
- 15 Wenzel Ln
- 30 Govan Dr
- 61 E Main St
- 36 N Liberty Dr
- 23 Sunrise Dr
- 8 Autumn Ln
- 807 Battalion Dr
- 73 Tomkins Ave
- 15 Pine Dr
- 17 John F. Kennedy Dr
- 50 Major Andre Dr
- 18 Lake Rd
- 161 Washburns Ln
- 30 Chestnut St Ny St
- 74 Beach Rd
- 3 N Mountain View
- 30 Ba Mar Dr
Your Personal Tour Guide
Ask me questions while you tour the home.