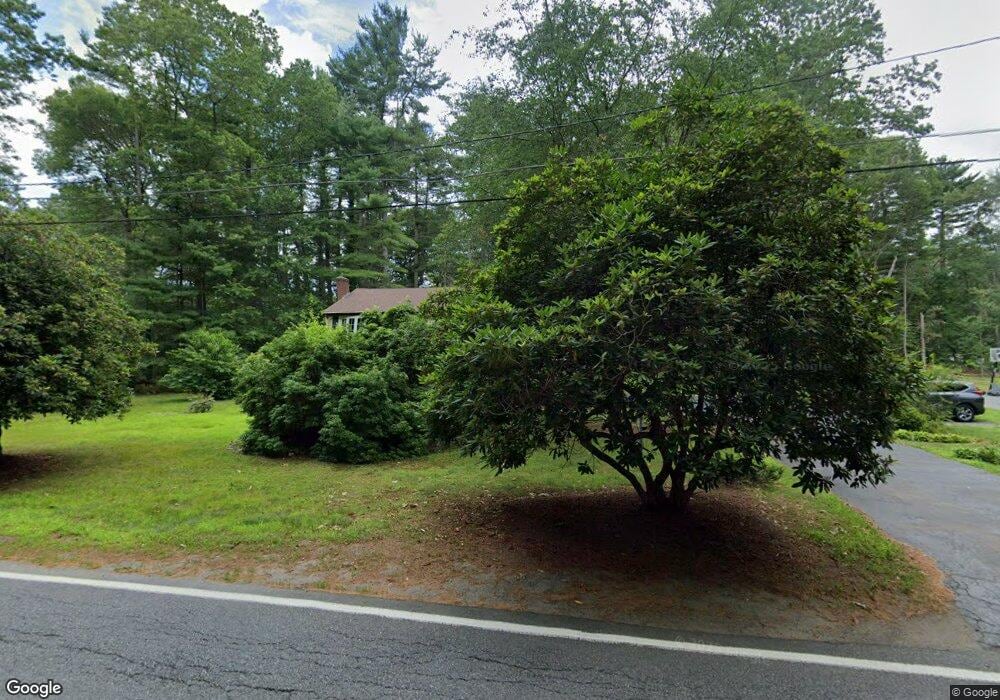
35 Moose Hill St Sharon, MA 02067
Estimated Value: $661,000 - $879,000
3
Beds
3
Baths
1,442
Sq Ft
$532/Sq Ft
Est. Value
About This Home
This home is located at 35 Moose Hill St, Sharon, MA 02067 and is currently estimated at $766,603, approximately $531 per square foot. 35 Moose Hill St is a home located in Norfolk County with nearby schools including Heights Elementary School, Sharon Middle School, and Sharon High School.
Ownership History
Date
Name
Owned For
Owner Type
Purchase Details
Closed on
Jun 18, 1990
Sold by
Kulig John W
Bought by
Demeris George K
Current Estimated Value
Home Financials for this Owner
Home Financials are based on the most recent Mortgage that was taken out on this home.
Original Mortgage
$148,000
Interest Rate
10.54%
Mortgage Type
Purchase Money Mortgage
Create a Home Valuation Report for This Property
The Home Valuation Report is an in-depth analysis detailing your home's value as well as a comparison with similar homes in the area
Home Values in the Area
Average Home Value in this Area
Purchase History
| Date | Buyer | Sale Price | Title Company |
|---|---|---|---|
| Demeris George K | $185,000 | -- |
Source: Public Records
Mortgage History
| Date | Status | Borrower | Loan Amount |
|---|---|---|---|
| Open | Demeris George K | $172,800 | |
| Closed | Demeris George K | $148,000 | |
| Previous Owner | Demeris George K | $155,000 |
Source: Public Records
Tax History Compared to Growth
Tax History
| Year | Tax Paid | Tax Assessment Tax Assessment Total Assessment is a certain percentage of the fair market value that is determined by local assessors to be the total taxable value of land and additions on the property. | Land | Improvement |
|---|---|---|---|---|
| 2025 | $11,100 | $635,000 | $426,400 | $208,600 |
| 2024 | $10,639 | $605,200 | $391,200 | $214,000 |
| 2023 | $10,409 | $559,900 | $365,800 | $194,100 |
| 2022 | $9,747 | $493,500 | $304,800 | $188,700 |
| 2021 | $9,653 | $472,500 | $287,400 | $185,100 |
| 2020 | $9,796 | $515,600 | $330,500 | $185,100 |
| 2019 | $9,261 | $477,100 | $279,700 | $197,400 |
| 2018 | $9,137 | $471,700 | $274,300 | $197,400 |
| 2017 | $8,907 | $454,000 | $256,600 | $197,400 |
| 2016 | $8,780 | $436,600 | $256,600 | $180,000 |
| 2015 | $8,063 | $397,200 | $233,200 | $164,000 |
| 2014 | $7,458 | $362,900 | $212,000 | $150,900 |
Source: Public Records
Map
Nearby Homes
- 27 Henry St
- 28 Norfolk Place
- 630 S Main St
- 180 Old Post Rd Unit 202
- 180 Old Post Rd Unit 206
- 180 Old Post Rd Unit 201
- 180 Old Post Rd Unit 405
- 180 Old Post Rd Unit 207
- 668 S Main St
- 97 Old Post Rd
- 91 Old Post Rd
- 111 E Foxboro St
- 0 U S Route 1
- 148 S Main St
- 5 Trowel Pond Shop Rd Unit C
- Lot One Old Wolomolopoag St
- Lot Two Old Wolomolopoag St
- 277 Everett St
- 1 Roseland St Unit A-1
- 16 Forest Rd